
Versatile Project Manager & Data Wizard 🌟
Versatile Project Manager & Data Wizard 🌟



View more →


L&D and HR Specialist
L&D and HR Specialist


View more →

Dynamic Data Analysis & Visualization Expert
Dynamic Data Analysis & Visualization Expert


View more →

Professional Data Cleaning and Bookkeeping services
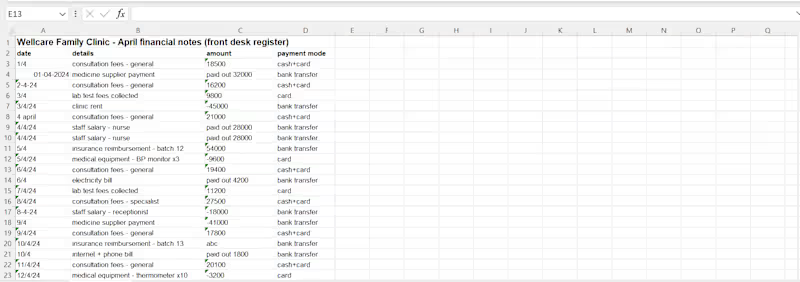
Hello guys, I am Bharat professional Bookkeeper where I take data from the client clean it and give the proper consistent and Structured Data
Today I had Data of WellCare Health Clinic where I get the Messy and Inconsistent data of the clinic which I had fixed the problem
What was the problem:
1.Was it Structured ❌
2.Is (http://2.Is) the data provided Consistent and Not Broken ❌
3.Is (http://3.Is) the data easily Recognisable by looking at it (like can we Identify it is expense, Utilities or Income ❌
4.Is (http://4.Is) it maintained in proper format ❌
How I fixed it using Excel:
1.First, I categorize the data properly in a Structure ✅
2.Then I put the data into proper format (Like 1/4/24 to 01-04-2024) ✅
3.I just take out the Inconsistent, Broken and duplicate data into Consistent data ✅
4.I made data easily Recognisable by looking it (Like We can easily identify expense utility and income by highlighting them. ✅
Left one is the messy and Inconsistent data and right one is Proper structured and Consistent Data
If you are someone looking for Bookkeeping service, I will do it with proper analysis and with a proper disciplined structure.
Thank you
#Bookkeeping (https://www.linkedin.com/search/results/all/?keywords=%23bookkeeping&origin=HASH_TAG_FROM_FEED) #Dataentry (https://www.linkedin.com/search/results/all/?keywords=%23dataentry&origin=HASH_TAG_FROM_FEED) #India (https://www.linkedin.com/search/results/all/?keywords=%23india&origin=HASH_TAG_FROM_FEED) #USA (https://www.linkedin.com/search/results/all/?keywords=%23usa&origin=HASH_TAG_FROM_FEED) #Datacleaning (https://www.linkedin.com/search/results/all/?keywords=%23datacleaning&origin=HASH_TAG_FROM_FEED) #Australia (https://www.linkedin.com/search/results/all/?keywords=%23australia&origin=HASH_TAG_FROM_FEED) #UAE (https://www.linkedin.com/search/results/all/?keywords=%23uae&origin=HASH_TAG_FROM_FEED)
1
132
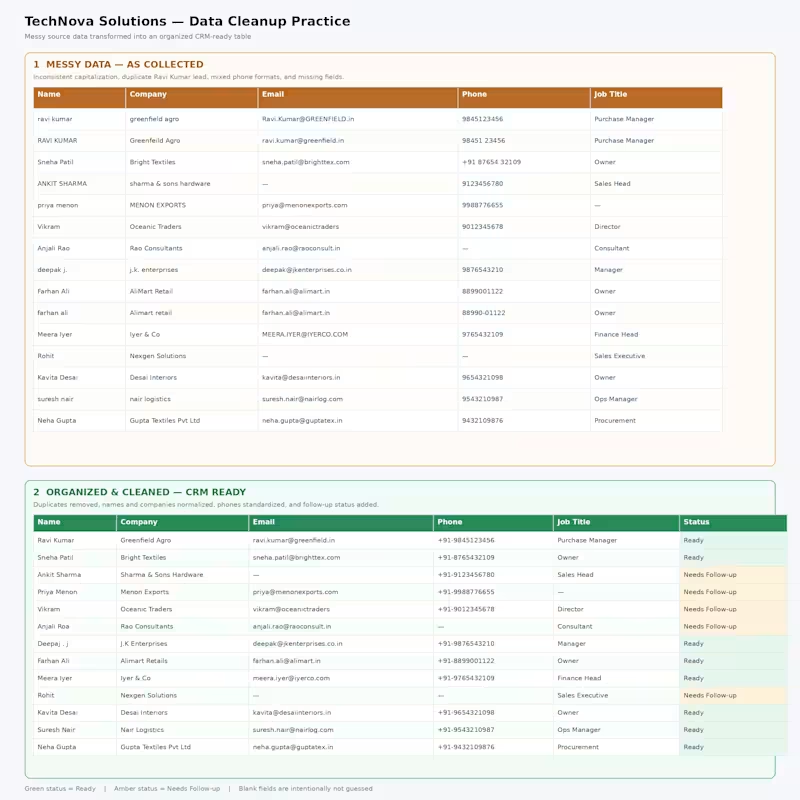
The image is a visual comparison of the customer-lead data before and after cleanup for TechNova Solutions.
Upper section: Messy data
The upper section shows the information exactly as it was collected from business cards and signup sheets. It contains inconsistent capitalization, different phone-number formats, duplicate entries, incomplete fields, and possible spelling variations. For example, “ravi kumar” and “RAVI KUMAR” represent the same person, while Farhan Ali appears twice with slightly different company and phone formatting.
Lower section: Organized and cleaned data
The lower section is the CRM-ready version. Duplicate leads have been removed, names and company names have been standardized, email addresses have been converted to lowercase, and phone numbers have been formatted using the +91-XXXXXXXXXX pattern. A new Status column has also been added.
Status
Meaning
Ready
The lead has the required email and phone information.
Needs Follow-up
Important information, such as an email address or phone number, is missing or incomplete.
The blank cells in the cleaned table are intentional. They indicate information that was not available in the original data; no details were invented. Overall, the image demonstrates how unstructured lead information can be transformed into a more consistent and usable CRM database.
1
366
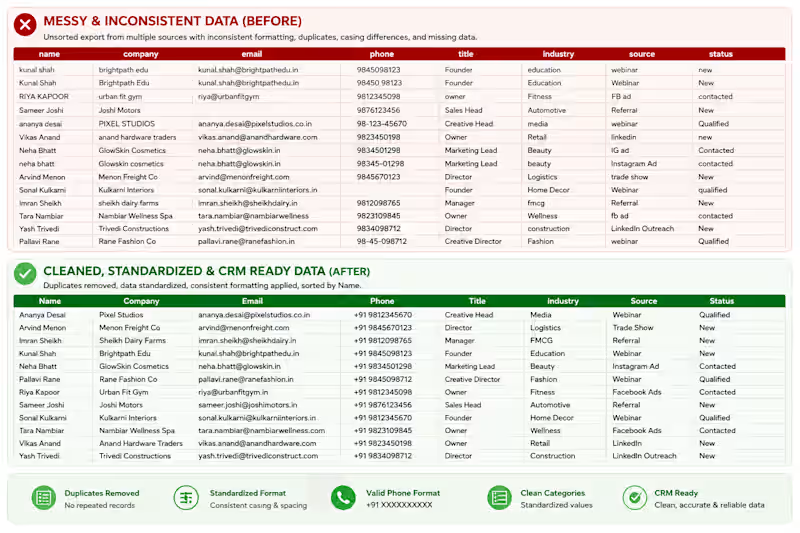
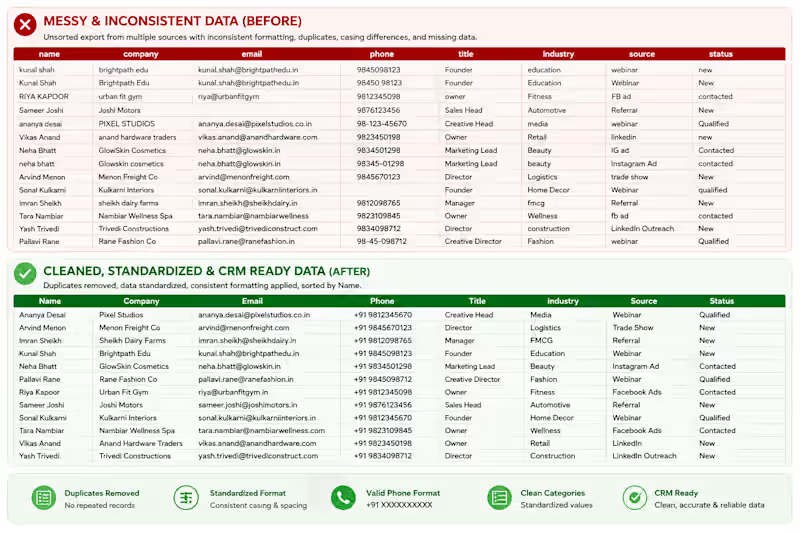
Hello Everyone This the Data of Vertex Media Agency which was Initially given Messy, Broken and Inconsistent Data
What was the Problem:
1.Actually, Data was Broken
2.It (https://2.It) was Messy
3.Non-Structured
4.Inconsistent
After Looking at the Data, I cleaned it and made it consistent, formatted, Structured Data
What changed after Improving and cleaning the data:
1.The Data is properly Structured
2.It (https://2.It) is CRM Ready
3. (https://3.It)Consistent
2
280

Startup recruiter. Design, engineering, GTM. 150+ closed.


View more →

Java Backend Developer | Oracle certified Associate
Java Backend Developer | Oracle certified Associate


View more →

Data Strategist Building AI-Powered Growth Solutions.
Skip the License Fee: I Built a Full Dashboard with Just JS
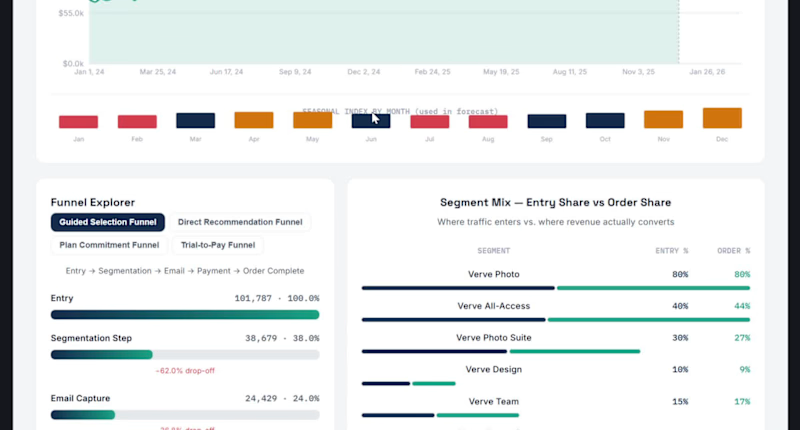
Verve Pulse: Revenue & Funnel Intelligence Dashboard
Most analysts stop at Power BI or Tableau. I wanted to go a layer deeper by building a fully custom dashboard in React to show what's possible when a BI tool's templates don't box you in.
Off-the-shelf visualization tools are great, but they come with real limits: fixed chart types, licensing costs, and UX you can't fully control. With JavaScript, I designed and built Verve Pulse from a blank canvas. Total control over layout, interactivity, and how the story of the data actually reads to stakeholders, and deployed it for free on Vercel, with no licensing cost and no vendor lock-in.
The dashboard unifies what's usually three separate reports - current performance, historical trend, and forecast as a single filterable view, with dedicated explorer views for 4 purchase funnels, 4 customer segments, and regional performance, plus a seasonality-adjusted forecast that shows its own assumptions instead of acting like a black box.
What I did:
Designed the full filter and data framework from a wireframe spec
Built a seasonality-adjusted forecasting model (trend decomposition + monthly seasonal indexing)
Designed and built the interactive dashboard end-to-end in React.
Deployed it as a free, live, secure product on Vercel
Why it matters: custom-coded dashboards trade a steeper learning curve for full design freedom, zero licensing cost, and infrastructure you fully control - a combination most Power BI/Tableau builds can't offer.
Skills & tools: Data analysis & forecasting · Dashboard/product design · React & Recharts · Git/GitHub · Vercel deployment
🔗 Code: https://github.com/SrijaaBizAnalyst/Revenue-Analytics-Dashboard-for-Verve-Studio
1
120
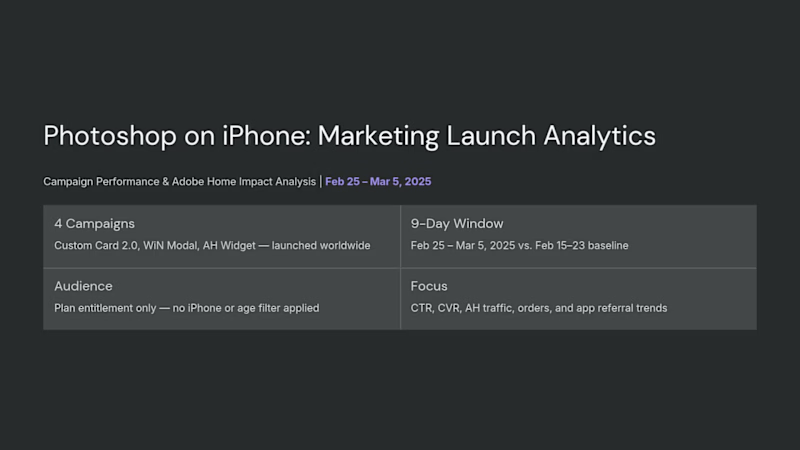
:Analyzed Photoshop on iPhone’s 2025 launch impact on Adobe Home, covering CTR, CVR, traffic, orders, and referrals. Found strong engagement but weak conversions, order declines, and trial churn, with recommendations for A/B testing, nurture flows, and benchmarking against Acrobat.
1
177
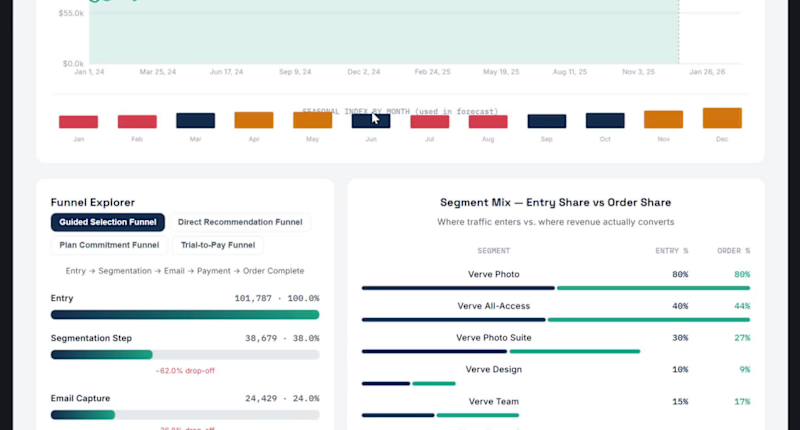
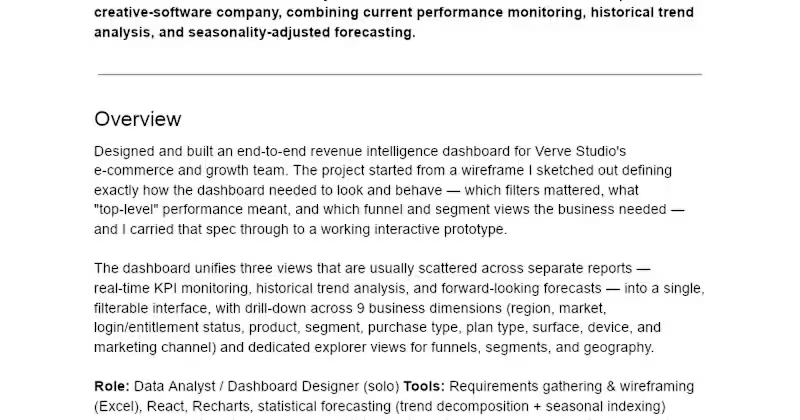
Verve Pulse is a multi-dimensional revenue analytics dashboard combining current KPIs, 2-year historical trends, and seasonality-adjusted forecasting in one filterable view. Built explorer views for 4 purchase funnels, 4 customer segments, and regional performance — replacing fragmented spreadsheet reporting with a single source of truth. Designed end-to-end from wireframe to interactive React prototype, deployed live on Vercel.
1
91

Data Analyst and Visualizer
Data Analyst and Visualizer


