Freelancers using Flutter in KarachiFreelancers using Flutter in Karachi
Senior Lead Graphic Designer | UI/UX & Product Engineer
New to Contra
Senior Lead Graphic Designer | UI/UX & Product Engineer
Production-ready AI agents and SaaS built to scale reliably.

$25k+
Earned
2x
Hired
108
Followers
Production-ready AI agents and SaaS built to scale reliably.
Cover image for From Instinct to Infrastructure: How
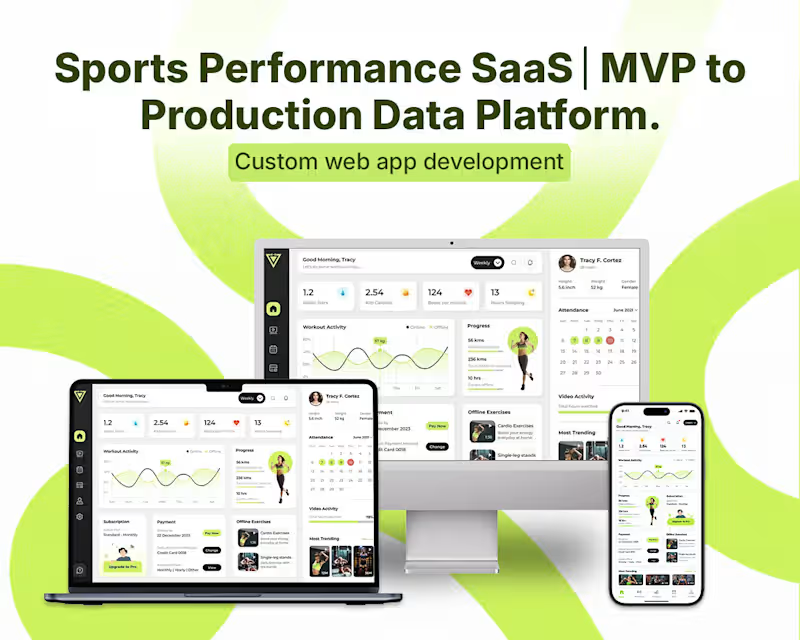
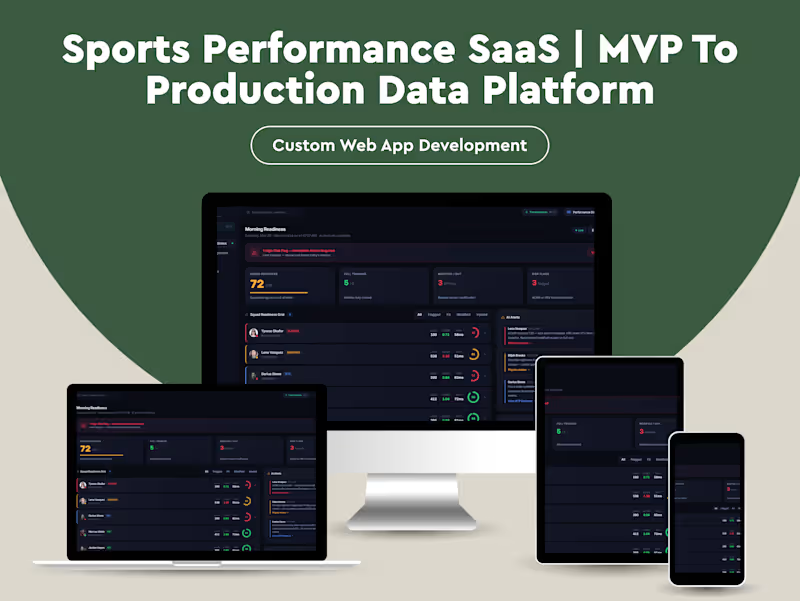
From Instinct to Infrastructure: How Athliq Went From Trainer's Notebook to Production Performance Platform ────────────────────────────────────────── The Person Who Understood the Problem Before Anyone Else Did Marcus had been a strength and conditioning coach for eleven years. He'd worked with professional football squads, Olympic track athletes, and NCAA programs. He knew exactly what was wrong with how performance data was managed, not because someone told him, but because he'd lived inside the problem every day. Every morning, he'd open four browser tabs, a spreadsheet, and a WhatsApp thread just to answer one question: Is this athlete safe to train today? HRV from one app. Sleep data from another. Yesterday's load from a Google Sheet. Wellness check-ins in a form nobody filled out consistently. Injury notes in a physio's personal folder. The picture was always incomplete, not because the data didn't exist, but because no system was designed to assemble it. He wasn't guessing the problem. He was the problem's daily victim. So he built something. ────────────────────────────────────────── The First Version Had Real Value What Marcus and a developer friend put together in six weeks was genuinely useful. A React frontend. Static JSON files simulating the data feeds he wished he had. A morning readiness dashboard showing each athlete's status: green, amber, red. ACWR calculations. A training plan view. A return-to-play protocol tracker. It looked like a real platform. It felt like one. When he demoed it to his performance director, the response was immediate: "This is what we've been trying to build for two years." The prototype surfaced something important. The problem wasn't that nobody had the data. The problem was nobody had designed the right lens to look at it through. Marcus had. His system organized information around the questions coaches actually ask, not the questions software vendors assume they ask. The initial build worked. For one squad. In static conditions. With fake data. And that was exactly the point where it started to matter, and exactly the point where its limitations became unavoidable. ────────────────────────────────────────── What Started Breaking The prototype had no backend. Data was hardcoded. Every "insight" was pre-written. The readiness scores didn't calculate; they were authored. When a second sport scientist saw the demo and said, "Can we plug in our GPS data?" there was no honest answer that didn't involve a complete rebuild. More specifically: The data layer was decorative. The JSON files looked real but required manual authoring for every scenario. There was no pipeline, no ingestion, no validation. Any live deployment would mean the dashboard showed stale or fabricated numbers, which in a performance context is worse than showing nothing at all. The AI insights were static strings. Every "AI-generated" recommendation was hardcoded text. In the prototype, this was fine. It demonstrated the concept. In production, it would mean the same insight appearing for every athlete regardless of their actual state, silently eroding clinician trust. The system had no concept of time. Training load calculations, ACWR ratios, wellness trends, all of these are temporal by definition. The prototype rendered them as snapshots. A real system needed rolling windows, historical comparison, and the ability to detect change over time. There was no role isolation. The role switcher in the UI was cosmetic. A physio and a performance director seeing the same underlying data with a CSS class change was not access control, it was theater. Nothing would survive a real integration. Real wearables return messy, incomplete, delayed data. The system had no error handling, no retry logic, no fallback states. The first real data feed would have broken the UI in ways that were invisible until they were catastrophic. The system was not wrong. It was early. ────────────────────────────────────────── Why They Didn't Just Fix It Themselves Marcus understood sport science. His developer understood React. Neither of them had built a production data system before, and that gap is not a skills deficiency, it is a domain specialization. What they needed was not someone to rewrite their frontend. The frontend was actually good. The visual hierarchy was sharp, the domain terminology was accurate, the workflows reflected how coaches genuinely think. That institutional knowledge was irreplaceable and not to be discarded. What they needed was: • A real-time data layer that could ingest from multiple sources reliably • A calculation engine that could run ACWR, load zone distributions, and readiness scoring against live data • A structured API contract between the front and back end • Authentication and role-based data scoping that actually enforced access boundaries • Observability, so when something silently broke, someone would know The prototype had proven the concept. The job now was to make the concept dependable. ────────────────────────────────────────── What We Actually Did We kept the frontend. Almost entirely. The visual design, the component architecture, the domain-accurate terminology, all of it stayed. We refactored the data layer, not the UI layer. The prototype's greatest strength was its UX fidelity to how coaches actually work, and we had no interest in rebuilding that from scratch. We built a real data ingestion pipeline. Rather than static JSON, we designed a service layer that could ingest from GPS units, HRV monitors, and wellness form submissions. Each source had its own adapter with validation, normalization, and error handling. Partial data was acceptable; silently wrong data was not. We replaced static calculations with a live computation engine. ACWR calculations now ran against a rolling 28-day window of actual load data. Readiness scoring pulled from real HRV baselines, not fixed numbers, and recalibrated as an athlete's personal baseline shifted over a training block. We replaced pre-written AI insights with a rules-based inference layer. Every insight shown in the platform now corresponded to a condition that was evaluated against live data. If Lena Vasquez's ACWR crossed 1.3 and her HRV dropped more than 15% from her 7-day baseline, the injury risk flag was triggered, not because it was hardcoded, but because those conditions were true. We implemented real role-based access control. A physio sees medical data, injury history, and RTP protocols. A sport scientist sees load analytics and benchmarks. A performance director sees the squad-level overview. A head coach sees readiness and today's session. The frontend already had role-switching built in, we gave it actual enforcement. We added observability throughout. Every data ingestion event was logged. Every calculation that produced an out-of-range result generated an alert. If a data source stopped sending, the system surfaced a staleness warning rather than silently displaying old numbers as current. ────────────────────────────────────────── Tech Stack React 19 + Vite, Tailwind CSS v3, Recharts, React Router v7, Node.js + Fastify, PostgreSQL + TimescaleDB, Redis, GPS/HRV/sleep data adapters (Catapult, Polar, Garmin), Google Forms/Typeform ingestion, Auth0, row-level security, Sentry, Datadog, Railway/Render, Vercel, Supabase Storage What Changed The morning workflow Marcus had been running across four tabs and a spreadsheet now ran in a single view that was populated automatically before he arrived at the training ground. The difference wasn't just convenience. It was confidence. When the dashboard flagged an athlete as high-risk, the coaching staff could interrogate why and trust the answer. When a return-to-play progression showed 80% completion, that number reflected actual criteria met against measured data, not a manually updated percentage. The platform was no longer a demo tool. It was a clinical decision-support system. For the squads using it, the shift was measurable: fewer reactive injury responses, more consistent load monitoring, and perhaps most importantly, a shared language between coaching staff, physios, and sport scientists built around the same data rather than competing interpretations of separate sources. ────────────────────────────────────────── The Part That Rarely Gets Said Most platforms built in this space start from the software side. Someone builds a data collection tool, adds a dashboard, and then tries to reverse-engineer what coaches actually care about. Athliq started from the other direction. A domain expert who understood the problem at a professional level built the frame first, and built it correctly. The pain points were real, the workflows were accurate, the terminology was precise. The engineering work didn't fix a bad idea. It made a good idea survivable. That distinction matters more than most technical case studies acknowledge. The hardest part of building a platform like this is not the infrastructure. It's knowing which questions to answer. That knowledge was already there. Our job was to make sure the system could keep answering them reliably, at scale, over time. ────────────────────────────────────────── Athliq is now in active deployment across two professional squads and one university performance program. The morning readiness dashboard processes real-time data from four integrated sources and serves role-scoped views to performance directors, sport scientists, physiotherapists, and athletes.
1
3
1.9K
Cover image for KovaRisk: When the Interface Knew
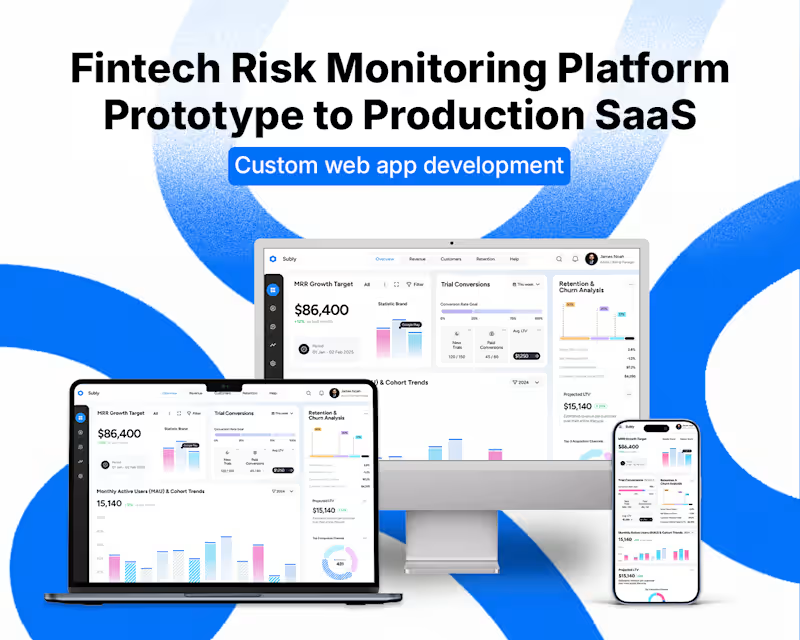
KovaRisk: When the Interface Knew More Than the System ────────────────────────────────────────── The Expert in the Room Compliance officers don't struggle to understand risk. They struggle to act on it fast enough. The team behind KovaRisk understood this precisely. They had spent years inside financial institutions watching the same dysfunction repeat: alerts buried in spreadsheets, investigations tracked in email threads, audit trails reconstructed after the fact. They knew what the interface needed to feel like because they'd lived with the one that didn't. So they built it. Fast. Exactly as they'd imagined it. What emerged was sharp: a risk monitoring dashboard with filterable alert feeds, entity profiles with 12-month risk trajectories, a rule engine with toggle controls, and an audit log that felt immutable. The scenario switcher let compliance teams stress-test different alert load states. The side panel made investigations feel contained and intentional. It looked like a system that had survived production. It hadn't been asked to yet. ────────────────────────────────────────── What Existed Was a Strong Interface - Not a System Every alert in KovaRisk was generated at startup. Every risk score was computed by a random seed function. Every status change - Investigating, Resolved, Escalated - lived in component state. Every timeline event was appended to an in-memory array. Every rule toggle disappeared on refresh. The audit log recorded nothing. The export downloaded a snapshot of what React was holding at that moment. The entity risk history was a curve drawn from a formula, not a record. The logic was there. But it had nowhere to live. A compliance officer investigating a high-risk wire transfer would open the side panel, read the plain-English rule explanation, mark the alert as Investigating, add an internal note - and lose every one of those actions the moment they refreshed the browser. No colleague could see what they'd done. No regulator could verify it had happened. In financial compliance, that's not a UX problem. It's a liability. The prototype validated the workflow brilliantly. It exposed exactly how a compliance team would move through their day. But three things were missing: a source of truth, a coordination layer, and a trail that could be audited under pressure. ────────────────────────────────────────── They Didn't Need More Features - They Needed a System Behind the Interface The team came with a clear idea and a working prototype. What they needed was the architecture that made the prototype a product - the layer that turned interface actions into durable facts. Not a rebuild. A foundation. ────────────────────────────────────────── The Layer That Made It Dependable Data Models: Giving State a Home The first thing to reconstruct was where the data should actually live. KovaRisk's frontend implied a clear schema - alerts, entities, rules, audit events - but none of it persisted. The production system needed a PostgreSQL core with five primary entities: • Alert — with foreign keys to Entity, Rule, Transaction, and a JSONB timeline column for ordered event history • Entity — with risk tier, jurisdiction metadata, and a one-to-many relationship to RiskScore snapshots • Rule — with active/disabled state, trigger thresholds, false-positive tracking, and a versioning mechanism so changes to rules didn't retroactively alter historical alerts • AuditEvent — append-only, with actor ID, action type, target reference, and a server-generated timestamp that clients cannot modify • InternalNote — owned by an alert, with authorship and a soft-delete flag to preserve compliance integrity Every status change, note, escalation, and flag the UI handled ephemerally became a write to this schema. The Alert Generation Engine: Replacing the Seed Function In the prototype, 85 alerts appeared because a loop ran 85 times at startup. In production, alerts are the output of a Transaction Monitoring Service - a background process that runs continuously against incoming transaction streams. This service: • Evaluates each transaction against every active Rule definition • Computes a risk score using rule weights, entity risk tier, jurisdiction flags, and behavioral baselines • Creates an Alert record only when a threshold is breached • Emits an event to a notification queue for high-risk triggers The rule engine the UI let users toggle wasn't decorative. Each rule mapped to an evaluation function in the monitoring service. Disabling a rule didn't just grey out a card - it removed it from the active evaluation set. Re-enabling it didn't retroactively generate alerts it would have caught; it resumed from the point of activation. That distinction mattered for regulatory defensibility. ────────────────────────────────────────── Async Workflows: The Operations the UI Implied But Couldn't Sustain Several interactions in the prototype implied workflows that couldn't complete synchronously. Escalation - When an alert was escalated, the UI changed a status badge. In production, escalation triggers a queue job that: notifies the senior compliance officer via a configured channel, creates a case record linking the alert, and starts a response SLA timer. The UI reflects the outcome - it doesn't produce it. Scheduled Screening - The Sanctions Screening Match rule in the prototype was static. In production, it's a nightly job that re-screens all active entities against updated OFAC, EU, and UN sanctions lists - generating new alerts if a previously clean entity now appears. The results feed back into the alert pipeline. Report Export - The dashboard's Export Report button downloaded a text file of whatever React was holding in memory. In production, report generation is an async job: the user requests the report, the job runs server-side against the live database, and a download link is returned when ready. The content is a verifiable, timestamped record - not a UI snapshot. ────────────────────────────────────────── The Audit Log: From Feed to Fact The prototype's audit log was populated by a generateAuditLog function. It looked comprehensive and immutable. It was neither. Production audit events are written by the API layer on every state-modifying operation - before the response is returned to the client. The table is append-only. No update operations are permitted on AuditEvent records. Timestamps are server-generated in UTC and stored with full precision. Actor identity comes from the authenticated session, not from a string the client sends. The audit log the interface displayed was a simulation of accountability. The production version is the accountability. ────────────────────────────────────────── Tech Stack 1. Frontend: React + Vite, React Router v6, Recharts, React Context + local state, TanStack Query 2. Backend: Node.js + TypeScript, Fastify, Prisma, PostgreSQL, Redis, BullMQ, Passport.js + express-session 3. Infrastructure: AWS ECS / Railway / Render, S3, AWS Secrets Manager / Doppler, Sentry + Datadog, GitHub Actions 4. External Integrations: OFAC / ComplyAdvantage, Refinitiv World-Check, SendGrid / SMTP, Webhooks  ────────────────────────────────────────── From Interface to System The prototype answered the right questions. It proved the workflow was sound, the information hierarchy was correct, and the alert investigation pattern worked the way compliance officers needed it to. What it couldn't answer was: what happens when two investigators open the same alert simultaneously? What happens when a rule change needs to take effect immediately across 200 pending alerts? What happens when a regulator asks for every action taken on a specific entity over the past 18 months? Those questions don't live in the interface. They live in the system. KovaRisk's interface was always strong. What it needed was the architecture to make it real - persistent, coordinated, auditable, and defensible under scrutiny. The logic existed from the beginning. We gave it somewhere to live.
2
1.9K
Cover image for Case Study: From Prototype to
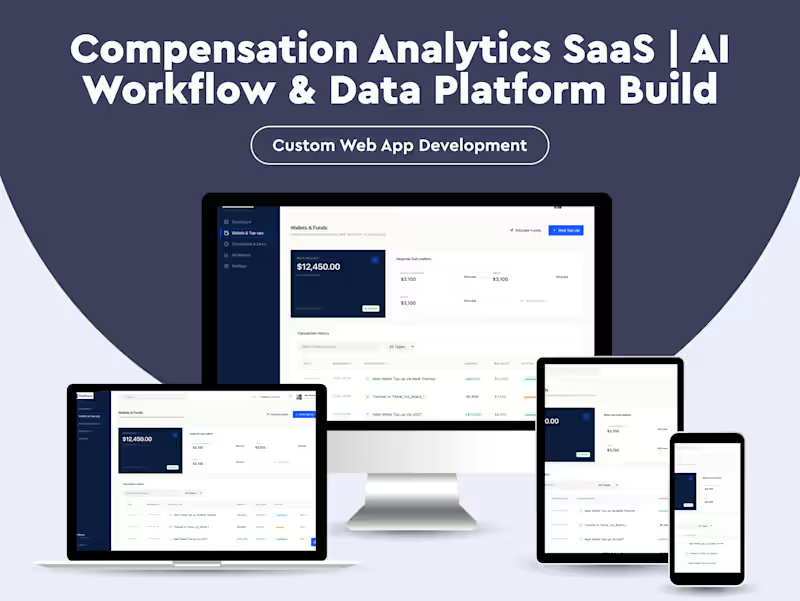
Case Study: From Prototype to Production — Building a Credit Management Platform for Ad Operations The Starting Point The founder wasn't guessing the problem. They had spent years inside the ad-credit ecosystem, managing wallet balances across regions, reconciling top-ups via bank wire and stablecoin, chasing compliance documents, and watching campaigns stall because a pixel stopped firing at 2am. They knew exactly what a credit management platform needed to look like. So they built one. Using Figma wireframes translated directly into a React frontend, they shipped a working prototype in days. Two portals were created. One for clients managing wallets and ad accounts, and one for internal operators handling treasury, compliance, and risk. It included real-time spend charts, AI-driven anomaly detection banners, a work queue for ops teams, and an embedded AI assistant that could answer questions about balances, compliance status, and pixel health. The prototype proved the concept. Clients could see their wallet balances, request top-ups, allocate funds to ad accounts, and track campaign performance. Admins could manage treasury operations, review KYB pipelines, monitor risk scores, and process a prioritized work queue. The domain logic was sound. The UX was sharp. But the system was never designed to survive real load. What Started Breaking The prototype worked on mock data. Every API call returned hardcoded arrays after a random delay. There was no backend. No database. No real authentication. The login screen accepted any email and assigned a role based on a toggle switch. Session state lived in localStorage as a raw JSON blob. This was fine for demos. It stopped being fine the moment real money entered the picture. The specific fractures: 1. No transactional integrity. Wallet balances, top-ups, fund transfers, and ad account allocations were all simulated. In a live system, a transfer of $25,000 from a master wallet to a regional sub-wallet is not a UI state change. It is a financial transaction that requires atomicity, audit trails, and rollback capability. The prototype had none of this. 2. Compliance was cosmetic. KYB document statuses were static labels. In production, document verification involves third-party identity providers, expiration tracking, automated re-upload reminders, and regulatory audit logs. The prototype rendered badges like "Verified", "Pending", and "Missing", but nothing enforced the state machine behind them. 3. Risk scoring was decorative. The AI risk badges showed tooltips like "Large P2P transfer detected, document expiring", but these were string literals, not outputs from a scoring model. Real risk assessment requires transaction pattern analysis, velocity checks, cross-referencing compliance status, and escalation workflows that route to the right ops agent. 4. The work queue had no backend. Urgent items like "$45,000 P2P transfer anomaly" appeared in the queue, but resolving them was just a frontend state toggle. There was no case history, no assignment logic, no SLA tracking, and no integration with the compliance or treasury systems that actually needed to act on these events. 5. Multi-tenancy was absent. The platform served one mock client and one mock admin. Scaling to dozens of clients, each with their own wallets, sub-wallets, ad accounts, compliance profiles, and credit limits, required data isolation, permissioning, and tenant-aware queries that did not exist. 6. Ad platform integration was faked. TikTok metrics like impressions, clicks, ROAS, and pixel health were all static datasets. Production requires OAuth-based API integrations, rate-limited data syncing, webhook listeners for pixel status changes, and graceful degradation when platform APIs go down. The founder understood all of this. The prototype was never meant to be the product. It was meant to prove that the product was worth building. Why They Brought In a Team The gap between the prototype and production was not a matter of fixing bugs. It was an architecture problem. The founder needed: - A real backend with transactional guarantees for financial operations - A compliance engine that could enforce document workflows across jurisdictions - A risk system that could ingest transaction data and surface actionable alerts, not static strings - Multi-tenant data architecture with proper isolation and access control - Ad platform integrations that could handle real API contracts, rate limits, and failures - Observability including logging, monitoring, and alerting so the ops team could trust the system under load They did not need someone to rewrite the frontend. They needed someone to build the system underneath it. What We Delivered Financial Operations Layer We replaced the mock API with a transactional backend. Every wallet operation, including top-ups, transfers, allocations, and refunds, now runs through an auditable pipeline with: - Atomic balance updates with optimistic locking - Double-entry ledger for every fund movement - Idempotent transaction processing to prevent duplicate charges - Full audit trail with actor, timestamp, and before and after state Top-up requests now flow through a verification pipeline with submission, proof-of-payment upload, approval, and balance credit. Each step is recorded and reversible. Compliance and KYB Engine - We built a document lifecycle system that replaces static badges with enforced state transitions: - Documents move through missing → uploaded → under_review → verified → expired with rules governing each transition - Expiration monitoring triggers automated client notifications before deadlines - Third-party identity verification integration for director ID matching - Jurisdiction-aware requirements where different regions require different document sets - Audit-grade logging for every status change, reviewer action, and override The KYB pipeline now routes cases to specific compliance agents based on workload, region, and verification type. Risk and Anomaly Detection We replaced hardcoded risk labels with a scoring system that evaluates: - Transaction velocity based on spend acceleration versus historical baseline - P2P transfer patterns and threshold breaches - Compliance status correlation, such as expired documents combined with high spend - Account dormancy detection where inactivity triggers review Risk scores update in near real time. High-risk events automatically generate work queue items with priority, context, and suggested actions. Work Queue and Case Management We transformed the frontend-only task list into an event-driven operations system: - Events from treasury, compliance, and risk systems automatically create queue items - Assignment logic routes items to the right agent based on type, region, and capacity - SLA tracking with escalation rules for overdue items - Case history that records every action, note, and resolution - Enforced status transitions so items cannot be resolved without required actions Multi-Tenant Architecture We designed the data layer for tenant isolation from the ground up: - Each client organization has isolated wallets, documents, ad accounts, and transaction histories - Role-based access control separates client-facing and admin-facing data - API endpoints are tenant-scoped to prevent cross-tenant data leakage - Admin views aggregate across tenants with proper permissioning Ad Platform Integration We built a sync layer for TikTok Ads with an architecture that supports additional platforms: - OAuth-based account linking with token refresh management - Scheduled metric pulls with rate limit awareness and backoff - Pixel health monitoring via event signal tracking instead of static labels - Graceful degradation where stale data is clearly labeled if APIs fail Observability We added the infrastructure the ops team needs to trust the system: - Structured logging for every financial operation, compliance action, and API call - Health dashboards for backend services, integration sync status, and queue throughput - Alerting on anomalies such as failed transactions, sync delays, and SLA breaches - Error tracking with business context, not just stack traces The Outcome The system went from a prototype that could demo well to a platform that could process real money, enforce real compliance, and surface real risk under real load. What changed: - Financial operations now run with transactional guarantees. Wallet balances are accurate, auditable, and reconcilable. - Compliance is enforced, not displayed. Document workflows follow regulated state machines with full audit trails. - Risk detection is continuous and contextual. The ops team acts on scored alerts instead of static labels. - The work queue drives operations. Events flow in automatically, route correctly, and track resolution against SLAs. - Multi-tenancy works. New clients onboard into isolated environments without architectural changes. - Ad integrations sync reliably. When they fail, the system clearly shows it instead of masking stale data. The founder’s instinct was right from the start. The domain model, the UX, and the operational workflows all held up. What we built was the engineering foundation that made it dependable. The system worked until it didn’t. Not because the idea was flawed, but because it was never designed to handle this level of complexity. The prototype proved the product. The production system proved it could scale. Tech Stack Overview 1. Backend: Node.js (NestJS) 2. API: GraphQL 3. Auth: Auth0 4. Database: PostgreSQL 5. Cache/Queue: Redis 6. Search: Elasticsearch 7. Infrastructure: AWS 8. Containers: ECS Fargate 9. CI/CD: GitHub Actions 10. IaC: Terraform 11. Integrations: Stripe 12. Risk Engine: Python (FastAPI) 13. ML Pipeline: scikit-learn 14. AI Assistant: OpenAI GPT-4 15. Vector Store: Pinecone
2
1.9K
Product Design, Growth and Developer | E-Books and Software
5.0
Rating
11
Followers
Product Design, Growth and Developer | E-Books and Software
Cover image for GPUStore: A Modern GPU Shopping
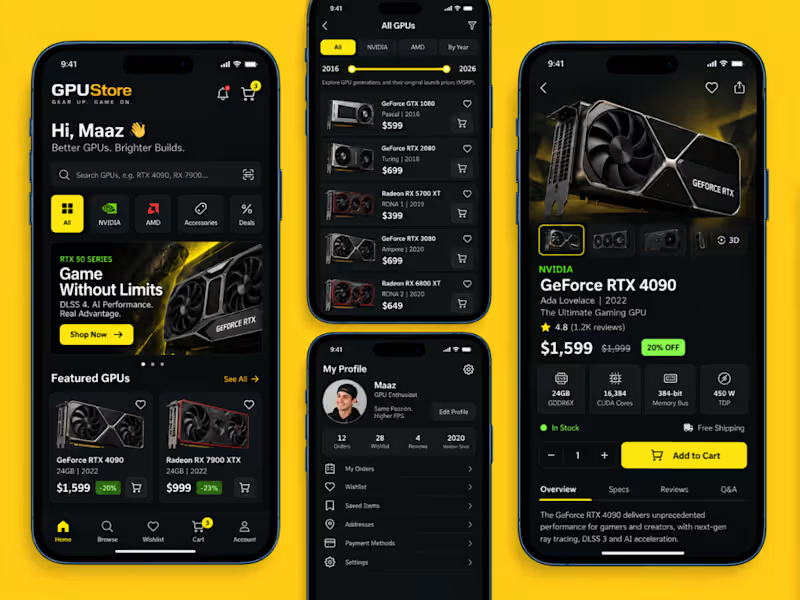
GPUStore: A Modern GPU Shopping and Discovery App I designed GPUStore to make buying graphics cards feel less like decoding a spec sheet and more like exploring a well-organized catalog. Instead of overwhelming users with dense tables and inflated resale listings, I structured the product around what PC builders actually ask: which generation is this, what did it originally cost, and what will it do for me? The visual identity pairs a dark charcoal interface with electric lime green accents. The green guides interaction. It marks active filter tabs, the Shop Now and Add to Cart buttons, the cart badge, saved hearts, and the NVIDIA brand label. Dark cards and high-contrast product renders give each card a premium, showroom feel while keeping specs and prices easy to read. The home screen opens with a personal greeting, a search bar with a real example query ("RTX 4090"), and quick category chips for All, NVIDIA, AMD, Accessories, and Builds. A bold RTX 50 Series banner promotes new releases, followed by a "Featured GPUs" section. Each card shows the architecture, release year, launch price, and a one-tap cart button. The All GPUs screen turns browsing into a timeline. Segmented filters (All, GTX, RTX, By Year) sit above a 2016 to 2026 range slider, so users can explore generations and their original launch prices (MSRP). Seeing the GTX 1080 at $599 next to the RTX 4090 at $1,599 makes a decade of pricing history readable at a glance. The product detail screen prioritizes clarity. An image carousel with wishlist and share actions leads into the architecture and release date, then a dedicated MSRP panel. A compact Key Specifications table follows (Ampere architecture, 8,704 CUDA cores, 10 GB GDDR6X, 320-bit memory bus, 320 W TDP). A sticky quantity stepper and Add to Cart button stay within thumb reach. A short note clarifies that launch price shows original MSRP and actual market prices may vary. The profile screen gives users a personal hub with their saved items, orders, builds, and member-since year. Wishlist, Orders, and Settings tabs keep everything in one place, and saved cards show the date each item was added. Across the app, a five-tab bottom navigation (Home, Browse, Wishlist, Orders, Account) keeps the structure predictable. Frontend I built the client as a cross-platform mobile app using React Native with TypeScript. React Navigation handles the bottom tabs and the stack flows between listing, detail, and cart. TanStack Query manages server data, caching, and loading states, while Zustand holds lightweight local state such as cart count, wishlist toggles, and active filters. The year-range slider and category filters update query parameters, so results refresh without a full reload. Reusable components (GPU card, spec row, filter chip, quantity stepper) are driven by a shared design-token file for the dark theme and green accent, keeping the UI consistent across screens. Backend The backend is a Node.js REST API (Express or NestJS) backed by PostgreSQL through Prisma. The core schema covers users, GPUs, wishlists, carts, cart items, orders, order items, and builds. Each GPU record stores brand, series (GTX or RTX), architecture, release date, MSRP, CUDA cores, memory size and type, bus width, and TDP. MSRP is stored separately from the live selling price, which matches the app's "launch price vs. market price" approach, and all money values are stored as integer cents to avoid rounding errors. Endpoints support search, brand, series, and year-range filtering (GET /gpus?series=RTX&yearFrom=2016&yearTo=2026), product details, cart and wishlist actions, and order history. Authentication uses JWT with refresh tokens, images are served through a CDN, and Stripe handles checkout. The result is a GPU shopping experience that feels premium, informative, and easy to navigate, built for gamers and creators.
1
169
Cover image for I designed this concept website
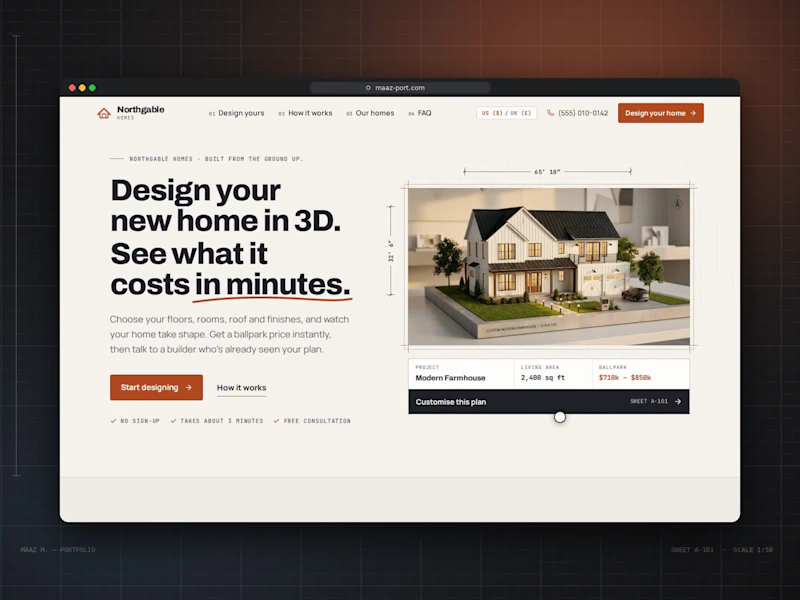
I designed this concept website for a custom home builder. The idea was to let people design their house themselves and see a real price before they ever speak to a salesperson. The challenge was to make something as complex as building a home feel simple, visual and even fun. Hero. The headline makes the promise in bold, tightly set type: "Design your new home in 3D. See what it costs in minutes.", with a hand-drawn rust underline beneath "in minutes." On the right, a model farmhouse sits inside an architect's frame with dimension lines (65′ 10″ × 32′ 6″) and a north arrow. Under it, a project card shows the design name, living area and ballpark price, with a dark "Customise this plan" bar. Three small checkmarks, "No sign-up," "Takes about 3 minutes" and "Free consultation," remove hesitation before the visitor starts. Visual language. I built the whole site around an architectural drawing set: Numbering: every section is labelled like a blueprint sheet (A-102, A-201, A-301), and monospace labels read like annotations on a plan. Grid: a faint drafting grid runs behind the page. Palette: warm paper cream, charcoal ink and one rust-orange accent for buttons and key prices. The navigation is numbered too (01 Design yours, 02 How it works, 03 Our homes, 04 FAQ), with a US/UK currency switch and a click-to-call phone number. The 3D designer. This is the heart of the site. On the left, a live 3D model of the house; on the right, a step-by-step panel: Start: choose from four starting designs (Contemporary, Modern Farmhouse, Traditional, Single-Storey) or start from scratch. Size: storeys, a living-area slider, a rectangle or L-shaped footprint, ceiling height and basement. Rooms: steppers for bedrooms and bathrooms, plus chips for a home office, laundry, pantry or media room. Roof: shape, pitch, material and colour swatches. Exterior: cladding type, colour and accent options like a stone base. Windows: window count, window style, rear doors and balconies. Outdoor: garage size, porch and patio, plus a roof terrace or fireplace. Finish: Essential, Premium or Luxury, ending on a summary. Every choice rebuilds the 3D house instantly, and a live estimate at the bottom of the panel updates with each decision. The viewer has its own controls: front, back, side and aerial cameras; a night mode with glowing windows; an inside cutaway of the floor plan; dimension overlays; and zoom. Supporting the decision. The rest of the page answers what a buyer asks next: "Three steps from first sketch to front door" uses large outlined numbers and simple line icons. "One team. One price. No surprises." lists the builder's guarantees. "Start from a favourite" shows four home designs as plan cards with specs and prices, each loading straight into the designer. The build schedule is a Gantt-style timeline across 11 months, from consultation to handover, separating "with you" steps from "we handle it." Client notes and FAQ: client notes pull out one large quote, and the FAQ gives five straight answers. The page closes on a dark section, "Your home, designed in minutes.", with a line drawing of a house and two clear actions: design your home or talk to the team.
0
19
Cover image for I designed this website for
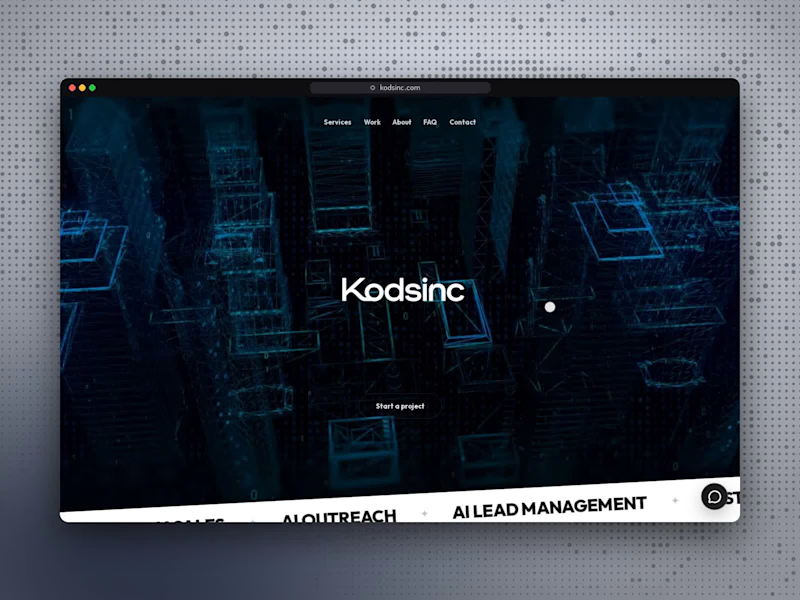
I designed this website for Kodsinc, a digital product and AI studio. The goal was to feel cinematic and ambitious from the first second, while explaining clearly what the studio builds and how it works with clients. The hero opens on a full-screen video of a glowing wireframe city with the Kodsinc wordmark at its centre. Beneath it, a tilted band scrolls through the studio's capabilities: AI voice agents, chat bots, automation, data and analytics, SaaS platforms and custom CRMs. As visitors scroll, the header condenses into a compact "Start a project" pill that expands into a numbered navigation menu. An AI assistant called Aria greets visitors, asks their name and offers suggested questions, so the site demonstrates the studio's own product from the start. For services, I designed a 3D card carousel. Seven vertical cards fan out side by side, and the selected one expands to reveal an illustration and the tools behind that service. The work section, "Work built to move," presents five products (Northstar, Flow CRM, AriaFin, WhatsApp SDR and Aria Assistant) as large stacked cards with device mockups. The page then builds trust. An interactive world map shows offices across five countries, and "Remote by location. Onsite in how we deliver" explains how the team stays close to clients. Security and compliance badges appear before the FAQ. The contact form sits beside the FAQ as a fill-in-the-blank sentence with a dropdown for the type of help needed. The page closes with the line "From Code to Intelligence," which sums up the studio in four words.
1
170
Production ready AI agents & SaaS platforms built for scale
New to Contra
Production ready AI agents & SaaS platforms built for scale

Cover image for Luxury E-Commerce Platform
A Premium Digital
Luxury E-Commerce Platform A Premium Digital Shopping Experience Built Around Craftsmanship Overview Designed and developed a fully custom e-commerce platform for a luxury brand, combining refined visual design with a seamless shopping experience. The goal was to create a digital storefront that reflected the quality, craftsmanship, and exclusivity of the products while making the purchasing journey intuitive across desktop, tablet, and mobile. The Challenge Luxury e-commerce requires more than a functional storefront. The digital experience needs to communicate the value of the products while keeping navigation, discovery, and checkout effortless. The platform needed to balance: Premium visual presentation Product storytelling and craftsmanship Intuitive navigation and discovery Responsive experiences across devices A frictionless shopping journey A scalable custom e-commerce foundation The Solution We created a bespoke e-commerce experience tailored around the brand and its products rather than relying on a generic storefront template. The experience focused on: High-end product presentation Immersive product browsing Clear product information and storytelling Streamlined shopping flows Responsive design across devices Consistent luxury-focused visual language What We Delivered Custom e-commerce experience Responsive UI/UX Product discovery and browsing Product detail experiences Shopping and checkout flows Mobile-optimized storefront Premium visual direction Scalable e-commerce architecture The Result A luxury-focused digital storefront that brings the sophistication of the physical products into the online experience—combining craftsmanship, usability, and premium presentation into one cohesive e-commerce platform.
0
25
Cover image for Moving From Prototype to Production
Our
Moving From Prototype to Production Our focus wasn't to redesign the product from scratch. The original UX already reflected how performance teams actually work, so we preserved the existing product experience while rebuilding the underlying infrastructure. Real-Time Data Infrastructure We replaced static datasets with a structured ingestion architecture capable of receiving information from multiple sources. The system was designed around: GPS and wearable data HRV and recovery metrics Sleep information Wellness submissions Training-load records External performance systems Each integration required validation, normalization, and error handling so inconsistent or incomplete data wouldn't compromise the platform. Live Performance Calculations Static calculations were replaced with dynamic processing. The platform could evaluate: ACWR Training-load trends Readiness scores Historical performance Rolling training windows Individual athlete baselines This allowed performance metrics to evolve with the athlete instead of remaining fixed to predefined values. Intelligent Performance Insights We replaced simulated recommendations with a data-driven inference layer. Insights were generated based on actual athlete conditions and predefined performance rules. For example, when training load increased significantly while recovery indicators dropped below an athlete's baseline, the system could surface an appropriate risk signal rather than displaying a generic recommendation. Role-Based Access Athliq required different users to work with different levels of information. We implemented role-based access so that: Performance Directors could monitor squad-level performance Sport Scientists could analyze training and performance metrics Physiotherapists could access injury and return-to-play information Coaches could focus on readiness and daily training Athletes could access relevant individual information Access restrictions were enforced at the system level rather than simply being controlled through the interface. Monitoring & Reliability Production systems need visibility when something goes wrong. We introduced logging and monitoring across data ingestion, calculations, and system events. The platform could identify issues such as: Missing data Delayed integrations Invalid records Calculation anomalies Stale data sources Application errors This helped prevent outdated information from being presented as current performance data. Technology Stack Frontend: React 19, Vite, Tailwind CSS, Recharts, React Router Backend: Node.js, Fastify Database: PostgreSQL, TimescaleDB Infrastructure: Redis, Vercel, Railway / Render, Supabase Storage Integrations: Catapult, Polar, Garmin, Google Forms, Typeform Authentication & Security: Auth0, Row-Level Security Monitoring: Sentry, Datadog The Result Athliq transformed a fragmented performance-monitoring workflow into a centralized platform. Instead of moving between multiple browser tabs, spreadsheets, forms, and communication channels, performance teams could access their core athlete information through a unified dashboard. The platform provided role-specific views, continuously updated performance information, historical context, and actionable signals from integrated data sources. More importantly, it created a shared data layer for coaches, sport scientists, physiotherapists, and performance directors. The product evolved from a concept-validation prototype into a production-ready performance intelligence platform. What Made the Project Interesting The biggest challenge wasn't simply building another analytics dashboard. It was translating real-world sports performance workflows into reliable software infrastructure. The original product concept came from someone deeply familiar with the domain. Our role was to preserve that domain knowledge while introducing the engineering foundations required for scalability, reliability, security, and live data processing. The result was a system designed around the questions performance teams actually need answered—not simply around the data available to them. Athliq Today Athliq has evolved into a multi-role sports performance platform supporting professional and university-level performance environments. The platform brings together data from multiple sources and transforms it into role-specific performance insights, giving teams a centralized environment for monitoring readiness, training load, recovery, and athlete progression. From a coach's notebook and fragmented data sources to a scalable performance intelligence platform.
0
67
Cover image for KovaRisk: Turning a Risk Monitoring
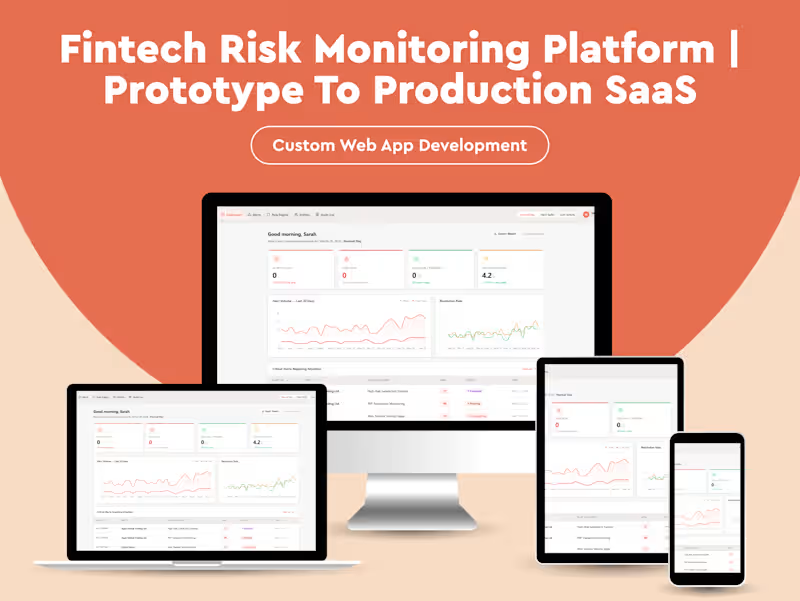
KovaRisk: Turning a Risk Monitoring Prototype Into a Production-Ready Fintech Platform From Interactive Compliance Dashboard to Persistent Risk Intelligence System KovaRisk started with a clear goal: give compliance teams a centralized way to monitor financial risk, investigate alerts, manage rules, and maintain reliable audit records. The original prototype already had a strong product foundation. It included: Risk and alert monitoring dashboards Filterable alert feeds Entity-level risk profiles Historical risk trends Configurable monitoring rules Investigation workflows Audit activity Scenario-based testing The interface effectively demonstrated how a compliance team could interact with the product. The challenge was that most of the underlying functionality was still simulated. The Gap Between the Prototype and Production The frontend represented a complete risk-management workflow, but much of its state existed only inside the browser. Alerts were generated when the application started. Risk scores were simulated. Status changes were stored in component state, and audit events existed only in memory. Refreshing the application could erase an investigation update, internal note, or rule configuration. For a financial compliance platform, persistence isn't simply a technical requirement. Investigations, decisions, and user actions need to remain traceable and verifiable. The next phase was therefore focused on building the system behind the interface. Building the Production Foundation Structured Data Architecture We translated the prototype's workflows into a persistent relational data model using PostgreSQL. The architecture introduced dedicated entities for: Alerts Financial entities Monitoring rules Risk-score history Audit events Internal investigation notes Transactions Relationships between these entities allowed actions performed through the interface to become durable records rather than temporary frontend state. Rule versioning was also introduced so historical alerts could remain associated with the conditions that existed when they were generated. Real-Time Alert Generation The prototype initially generated a predefined set of alerts. We replaced this behavior with a transaction-monitoring architecture capable of evaluating incoming transactions against active compliance rules. The system could: Evaluate transactions against configured rules Calculate risk scores Consider entity and jurisdiction risk Identify threshold breaches Create persistent alert records Trigger notifications for high-risk events Rule controls in the dashboard became connected to the actual monitoring engine. Disabling a rule affected future evaluations rather than simply changing the appearance of a UI component. Asynchronous Compliance Workflows Several actions required more than a simple frontend state change. We introduced background processing for operational workflows such as: Alert Escalation Escalating an alert could initiate notifications, create a corresponding case, and begin tracking the response timeline. Scheduled Screening Entities could be periodically screened against external sanctions data, with newly identified matches feeding back into the alert workflow. Report Generation Instead of exporting whatever happened to be loaded in the browser, reports were generated server-side from the current database state and made available once processing completed. This created a more reliable separation between the user interface and the underlying business operations. Building a Reliable Audit Trail One of the most important parts of KovaRisk was transforming the audit interface from a simulated activity feed into a persistent record of system events. Audit events were generated at the API layer whenever important state changes occurred. Each event captured: Authenticated user Action performed Target entity Event type Server-generated timestamp Relevant activity context The audit records were designed to be append-only, preventing normal application workflows from modifying historical events. This gave compliance teams a much more dependable record of how alerts and investigations progressed. Technology Stack Frontend: React, Vite, React Router, Recharts, TanStack Query Backend: Node.js, TypeScript, Fastify, Prisma Database & Processing: PostgreSQL, Redis, BullMQ Authentication: Passport.js, Express Session Infrastructure: AWS ECS, Railway / Render, Amazon S3 Security & Monitoring: AWS Secrets Manager, Doppler, Sentry, Datadog Integrations: OFAC / ComplyAdvantage, Refinitiv World-Check, SendGrid / SMTP, Webhooks The Result KovaRisk evolved from an interactive compliance prototype into a structured fintech risk-monitoring platform. The interface remained focused on the workflows compliance teams needed, while the underlying architecture introduced: Persistent data Automated alert generation Configurable rule processing Background workflows External screening integrations Reliable report generation Role-aware system operations Persistent audit records The key transformation wasn't adding more screens. It was connecting every important interaction in the interface to a dependable backend process. The prototype demonstrated how compliance teams should work. The production architecture made those workflows persistent, automated, and operationally reliable.
0
70
Cover image for From Prototype to Production: Building
From Prototype to Production: Building a Scalable Credit Management Platform for Ad Operations Transforming a Conceptual Ad-Credit System Into a Production-Ready Financial Operations Platform The platform was designed around a complex operational challenge: managing advertising credit, wallets, compliance, risk, and campaign activity across multiple clients and regions. The original product concept came from deep experience in the ad-credit ecosystem. The workflow covered everything from wallet funding and regional allocations to KYB verification, transaction monitoring, campaign performance, and operational support. A working React prototype had already demonstrated the core experience. It included separate portals for clients and internal operations teams, with features such as: Wallet and balance management Ad account allocation Top-up requests Campaign performance dashboards Compliance monitoring Risk indicators Operations work queues AI-assisted support Treasury management The product vision was validated. The next challenge was creating the infrastructure required to operate it with real financial data. From Mock Data to Real Infrastructure The prototype relied heavily on simulated API responses and frontend state. That worked well for demonstrating workflows, but financial operations require persistent data, transactional integrity, authentication, auditability, and controlled access. We rebuilt the underlying architecture while preserving the validated frontend experience. Financial Operations & Wallet Management We introduced a transactional backend for core financial operations, including: Wallet top-ups Fund transfers Regional wallet allocation Ad account funding Refunds Balance reconciliation A double-entry ledger provided a structured record of every movement of funds. Transactions were designed with: Atomic balance updates Optimistic locking Idempotent processing Transaction history Actor tracking Before-and-after state records Full auditability Top-up requests were also converted into structured workflows covering submission, payment verification, approval, and balance crediting. Compliance & KYB Management The prototype represented compliance through simple status indicators. We replaced those static states with a structured KYB lifecycle. Documents could progress through stages such as: Missing → Uploaded → Under Review → Verified → Expired The system introduced rules governing each transition, along with: Document expiration monitoring Automated notification workflows Identity verification integrations Region-specific compliance requirements Reviewer activity tracking Compliance overrides Audit history Cases could also be routed to compliance agents according to factors such as workload, region, and verification requirements. Risk & Anomaly Detection Static risk indicators were replaced with a dedicated risk evaluation layer. The platform could evaluate multiple signals, including: Transaction velocity Changes in spending behavior P2P transfer patterns Threshold breaches Account activity Compliance status Dormancy indicators Risk conditions could generate prioritized operational alerts with relevant context and recommended actions. This connected the risk engine directly to the operations workflow rather than treating risk as a visual indicator inside the dashboard. Operations Work Queue The original work queue was primarily frontend-driven. We transformed it into an event-based operations system. Events from financial, compliance, and risk workflows could automatically create operational tasks. The system supported: Intelligent task assignment Regional routing Capacity-based allocation SLA monitoring Escalation workflows Case history Required-action validation Resolution tracking Every operational case could maintain a complete history of actions, notes, and status changes. Multi-Tenant Architecture The production system needed to support multiple client organizations while keeping their financial and compliance data isolated. We introduced tenant-aware architecture across the data and API layers. Each organization could maintain its own: Wallets Ad accounts Transactions Compliance records Credit limits Operational history Role-based permissions separated client-facing functionality from internal administrative operations, while tenant-scoped API access helped prevent cross-organization data exposure. Advertising Platform Integration We also replaced simulated advertising metrics with a dedicated integration layer. The architecture supported TikTok Ads through: OAuth account authorization Token refresh handling Scheduled metric synchronization Rate-limit awareness Retry and backoff strategies Pixel health monitoring API failure handling When an external platform became unavailable, the system could clearly identify stale information rather than presenting outdated metrics as current. Observability & Infrastructure Production financial systems require visibility across both technical and business operations. We introduced: Structured application logging Transaction monitoring Integration health checks Queue monitoring SLA alerts Error tracking Backend service dashboards Synchronization monitoring This gave operations teams visibility into both application health and business-critical events. AI & Risk Intelligence The platform also incorporated intelligent services into the broader architecture. The risk layer was supported by a Python-based service and machine-learning pipeline, while an AI assistant provided a conversational interface for accessing relevant operational information. The architecture included: Python / FastAPI risk services scikit-learn ML workflows OpenAI-powered AI assistant Pinecone vector storage These capabilities were integrated into the broader platform rather than operating as isolated AI features. Technology Stack Backend: Node.js, NestJS API: GraphQL Authentication: Auth0 Database: PostgreSQL Caching & Queues: Redis Search: Elasticsearch Cloud Infrastructure: AWS, ECS Fargate CI/CD: GitHub Actions Infrastructure as Code: Terraform Payments: Stripe Risk Engine: Python, FastAPI Machine Learning: scikit-learn AI: OpenAI GPT-4 Vector Database: Pinecone The Outcome The platform evolved from a prototype designed to demonstrate the concept into a production-oriented system capable of supporting real financial and operational workflows. The transformation introduced: Transaction-safe financial operations Structured compliance workflows Continuous risk evaluation Event-driven operations management Multi-tenant architecture Live advertising integrations Automated monitoring and alerts AI-assisted operational intelligence The original prototype had already established the product vision and user experience. Our work focused on building the engineering foundation underneath it—turning simulated workflows into persistent, secure, scalable, and operationally reliable systems. From an impressive prototype to a financial operations platform built for real-world complexity.
0
75
Lead Full Stack Developer | AI/ML Engineer | Data Scientist
New to Contra
Lead Full Stack Developer | AI/ML Engineer | Data Scientist
AI & Full-Stack Developer | SaaS & Automation

New to Contra
AI & Full-Stack Developer | SaaS & Automation
Cover image for Facebook Ads & Lead Generation
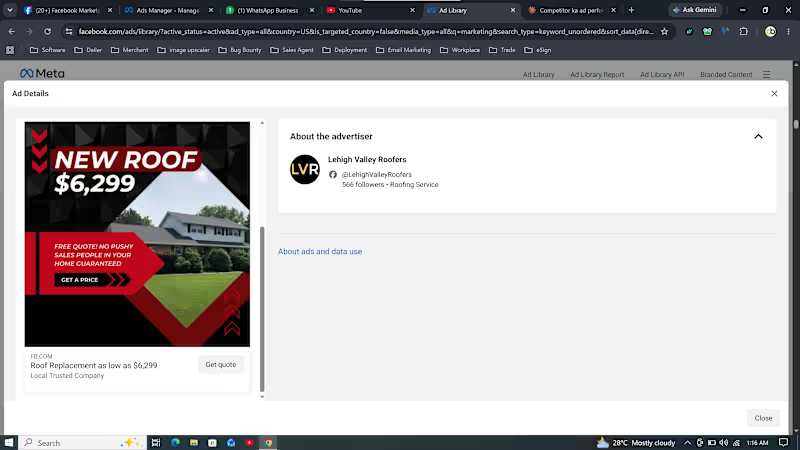
Facebook Ads & Lead Generation for Roofing Company I managed a targeted Facebook Ads campaign for a roofing company, focused on generating qualified local leads and connecting the business with homeowners looking for professional roofing services. The campaign was designed to reach relevant local audiences through Facebook advertising, using service-focused messaging and lead generation strategies to turn paid social traffic into potential customer inquiries. What I Worked On Facebook Ads Campaign Management Meta Ads Roofing Lead Generation Local Lead Generation Roofing Company Marketing Audience Research & Targeting Local Audience Targeting Ad Copy & Creative Optimization Lead Generation Campaigns Campaign Performance Tracking Budget Optimization Conversion-Focused Advertising Retargeting Strategy Performance Marketing Campaign Focus The primary objective was to generate high-quality roofing leads from relevant local prospects. I focused on identifying the right audience, creating service-oriented advertising, optimizing campaign targeting, and monitoring performance to improve the overall lead generation process. My Approach I used a combination of audience targeting, compelling ad messaging, creative optimization, and campaign performance analysis. The campaign was continuously monitored to identify opportunities for improving targeting, engagement, and lead generation efficiency. Project Outcome The campaign established a targeted Facebook lead generation strategy for a roofing business, helping the company reach potential customers in its service area and create a more structured approach to generating roofing inquiries through paid social media. Have a roofing company or local service business that needs more qualified leads? Let's talk. 📅 Book a 30-minute call: https://calendly.com/codexstechnology/30min #FacebookAds #MetaAds #LeadGeneration #RoofingMarketing #RoofingLeads #RoofingAdvertising #LocalLeadGeneration #LocalBusinessMarketing #FacebookAdvertising #PaidSocial #PerformanceMarketing #LeadGenerationCampaign #DigitalMarketing #ConversionOptimization #MetaAdvertising
0
33
Cover image for Meta Ads & Lead Generation
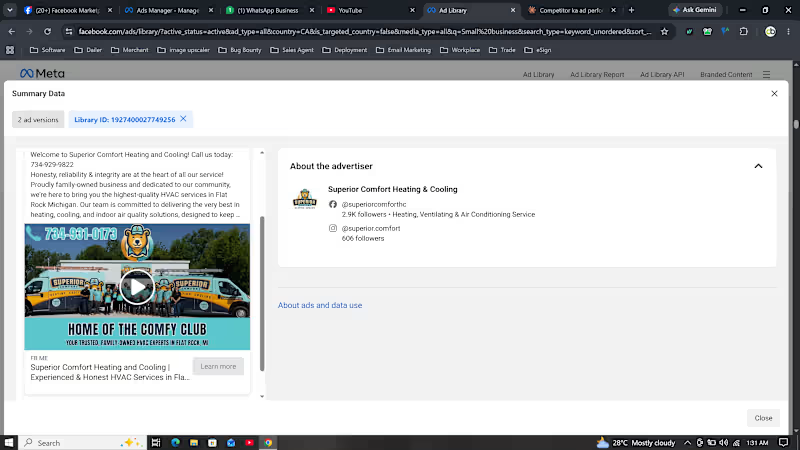
Meta Ads & Lead Generation for HVAC Company I managed a targeted Meta Ads campaign for an HVAC company, focused on generating qualified leads and connecting the business with potential customers looking for heating, cooling, and HVAC services. The campaign was designed around Facebook and Instagram advertising, with a focus on local audience targeting, relevant ad messaging, lead generation, and continuous campaign optimization. What I Worked On Meta Ads Campaign Management Facebook Advertising Instagram Advertising HVAC Lead Generation Local Service Business Marketing Audience Research & Targeting Local Audience Targeting Ad Creative & Copy Optimization Lead Generation Campaigns Campaign Performance Monitoring Budget Optimization Conversion-Focused Advertising Retargeting Strategy Performance Marketing Campaign Focus The main objective was to generate qualified HVAC leads through targeted Facebook and Instagram advertising. I focused on reaching relevant local audiences, presenting clear service-focused messaging, and optimizing the campaign toward users who were more likely to request information or HVAC services. My Approach The campaign combined audience targeting, compelling ad messaging, creative testing, and ongoing performance analysis. I monitored campaign performance and refined targeting and advertising elements to improve lead quality and make the campaign more efficient. Project Outcome The project provided a focused Meta Ads lead generation system for an HVAC service business, helping connect the company with relevant local prospects while establishing a structured approach to paid social advertising. Have a local service business and need more qualified leads through Meta Ads? Let's talk. 📅 Book a 30-minute call: https://calendly.com/codexstechnology/30min #MetaAds #FacebookAds #LeadGeneration #HVACMarketing #HVACLeads #HVACAdvertising #LocalBusinessMarketing #LocalLeadGeneration #InstagramAds #PaidSocial #PerformanceMarketing #FacebookAdvertising #LeadGenerationCampaign #DigitalMarketing #ConversionOptimization
0
37
Cover image for E-commerce Meta Ads & Sales
E-commerce Meta Ads & Sales Marketing I managed a Facebook & Instagram advertising campaign for an e-commerce store, focusing on reaching the right audience, generating product interest, and driving sales through targeted Meta Ads. The campaign was built around an e-commerce sales objective, with a focus on audience targeting, creative testing, campaign optimization, and improving the quality of traffic reaching the store. What I Worked On Meta Ads Campaign Management Facebook Ads Instagram Ads E-commerce Advertising Sales & Conversion Campaigns Audience Research & Targeting Interest & Behavioral Targeting Ad Creative Testing Ad Copy Optimization Campaign Performance Monitoring Budget & Bid Optimization Conversion-Focused Advertising Retargeting Strategy Performance Marketing Campaign Focus The primary goal was to use Meta Ads to drive targeted traffic and potential customers to the e-commerce store, while continuously monitoring campaign performance and optimizing the advertising strategy. I focused on reaching relevant audiences, testing different advertising approaches, and improving campaign efficiency based on performance data. My Approach I structured the campaign around the customer journey — from audience targeting and ad engagement to website visits and purchase intent. Campaign performance was monitored throughout the process to identify stronger audiences, improve ad creatives, refine targeting, and make better use of the available advertising budget. Project Outcome The campaign provided hands-on experience in managing e-commerce Facebook Ads and Instagram Ads, with a focus on sales-oriented advertising, audience targeting, and ongoing campaign optimization. Have an e-commerce store and want to turn paid social traffic into customers? Let's talk. 📅 Book a 30-minute call: https://calendly.com/codexstechnology/30min #MetaAds #FacebookAds #InstagramAds #EcommerceMarketing #EcommerceAds #PerformanceMarketing #PaidSocial #FacebookAdvertising #EcommerceGrowth #DigitalMarketing #SalesMarketing #ConversionOptimization #SocialMediaAdvertising #LeadGeneration #MetaAdvertising
0
43
Full-Stack Developer | Building Seamless Mobile & Web Apps
New to Contra
Full-Stack Developer | Building Seamless Mobile & Web Apps

Web, App, Design & Marketing for Growing Brands

New to Contra
Web, App, Design & Marketing for Growing Brands