Does someone on your team lose a day or two building the sales report every week or month?
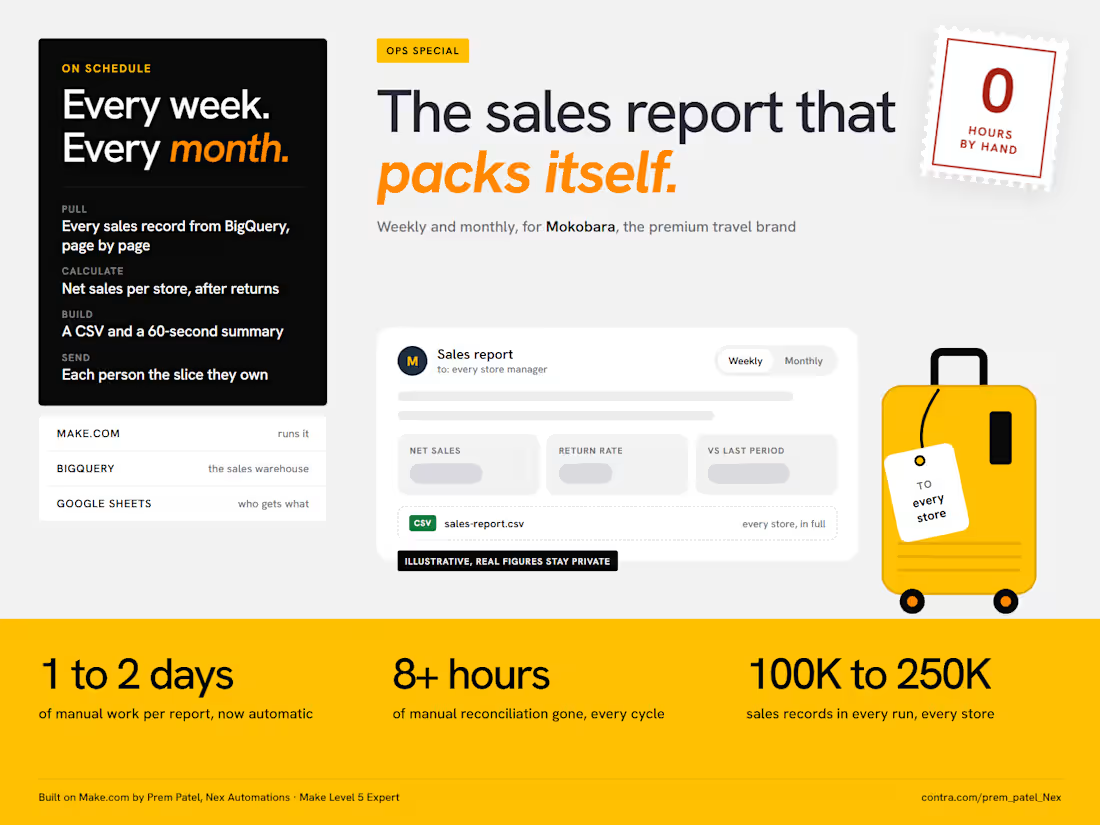
That was the starting point at Mokobara, the premium travel brand. Pulling sales across all their stores, checking returns, reconciling the numbers and emailing each manager took 1 to 2 days every cycle, with 8+ hours of that spent just reconciling.
I built them an automation on Make.com (http://Make.com) a few months ago. It has run on its own ever since, weekly and monthly:
Make pulls every sales record from BigQuery, 100K to 250K per cycle. That is too many for one request, so it reads them page by page and stitches them back together.
It calculates the numbers the team actually uses: net sales per store after returns and discounts, return rates and the change against the last period.
It builds a CSV with the full breakdown and a short email summary you can read in 60 seconds.
It reads a Google Sheet of store representatives and emails every one of them the report for their own store.
The result: the reporting problem is gone. The report went from 1 to 2 days of manual work to fully automatic, and the 8+ hours of reconciliation dropped to zero.
Two things I would do the same way again:
Calculate "net sales" in the automation, not in the warehouse. The business rule for what counts as a net sale is not what the raw data stores.
Send people their slice, not the whole report. One report for everyone gets skimmed by everyone.
The figures in the image are placeholders, the real ones stay with the client.
What report is your team still building by hand? Tell me where the data lives and I will tell you how I would automate it.
5
622
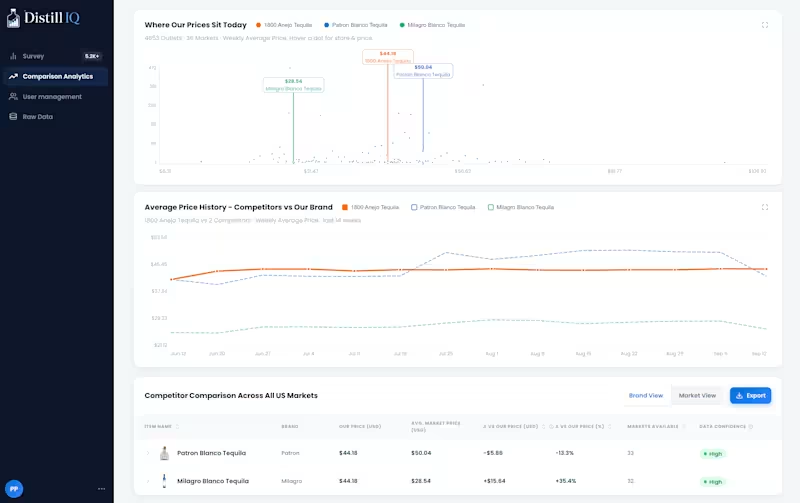
I designed and built Distill IQ, a full-stack retail pricing intelligence platform for a US-based liquor business. The application processes and presents large-scale pricing data through interactive product surveys, competitor comparison analytics, raw data exploration, and user/access management. I worked across the React frontend, Python backend, APIs, BigQuery data layer, business logic, and UI components to build the platform from the ground up.
Key features:
Pricing Survey: 5,200+ SKUs, 110+ brands, search and advanced filtering
Competitor Analytics: Compare products across markets with average, median, mode, price ranges, and price gaps
Market Analytics: Interactive price distribution, historical trends, and competitor comparison
Raw Data Explorer: BigQuery-backed data exploration with filtering, pagination, and export
User Management: User accounts, roles, permissions, market access, and catalog management
Reusable UI: Tables, filters, cards, charts, forms, and responsive components
1
220
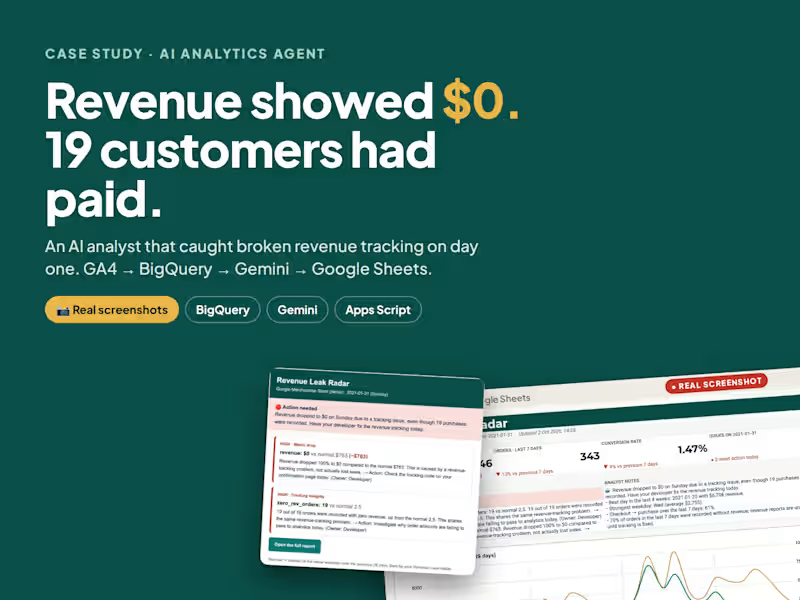
Revenue Leak Radar: AI Analyst That Caught Broken Tracking on Day 1
📸 Real build, real screenshots, not mock-ups.
I built an AI analyst that checks a store's GA4 data every morning, spots revenue drops, funnel leaks and broken tracking, and explains each issue in plain English with a cost, an action and an owner.
The result: when revenue showed $0 but 19 customers had actually paid, the radar flagged it as a tracking problem on the first day, not a sales crash.
What it does:
• GA4 → BigQuery: 10 business metrics every day
• Compares each day to the same weekday over 28 days
• Catches orders recorded without revenue
• Gemini writes the diagnosis, action and owner
• Sends a visual report and an alert email
• "Ask your data" box: type a question, it writes and runs the SQL
Tools: Google Apps Script, BigQuery, GA4, Gemini API, Google Sheets
Cost: $0 (free tiers only)
Tested on Google's public GA4 demo dataset (Google Merchandise Store).
Full case study: https://claude.ai/artifact/KjLpN5RTwNLKTt3Ng77ssV
1
248
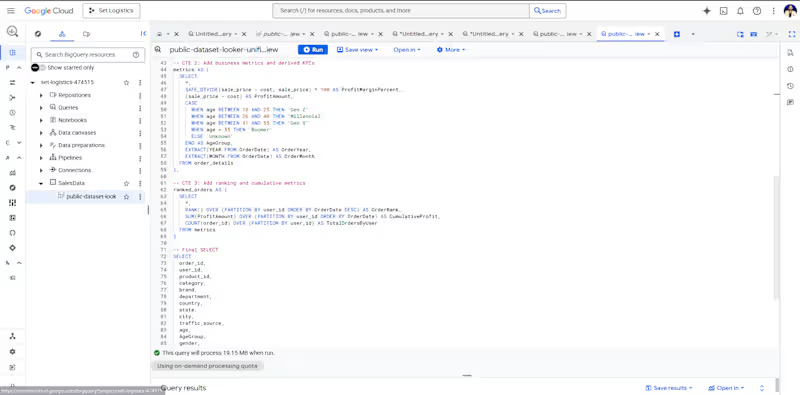


Enterprise Marketing Analytics & Attribution — West Pharmaceutical Services
Built analytics and measurement systems connecting digital marketing, customer behavior, CRM, advertising, and commercial outcomes for a global enterprise. Worked across GA4, GTM, BigQuery, SQL, Python, Power BI, advertising platforms, customer identity resolution, attribution, and executive reporting. Programs contributed to major improvements in digital revenue, sales efficiency, onboarding performance, retention economics, and visibility into marketing ROI.
Skills: GA4, GTM, BigQuery, SQL, Power BI, Attribution, Marketing Analytics, CRM
0
41