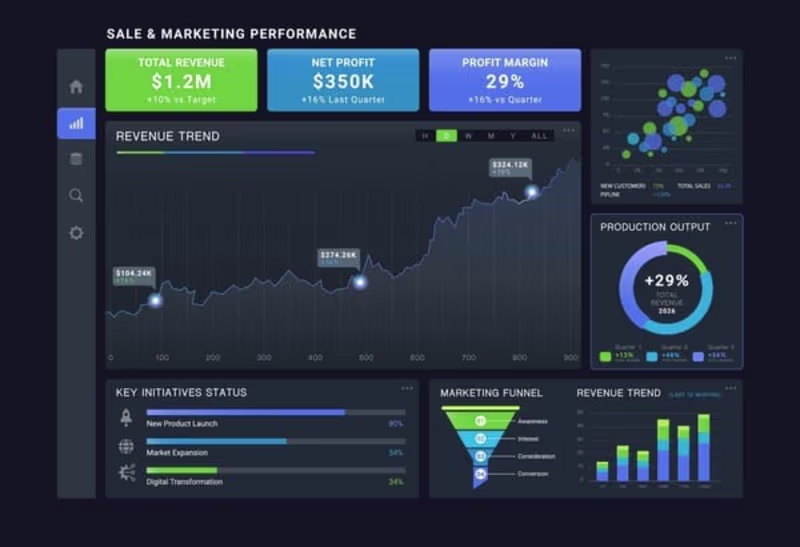
Excel & KPI Dashboards for Small Business Decisions
- 100
- Followers
Excel & KPI Dashboards for Small Business Decisions


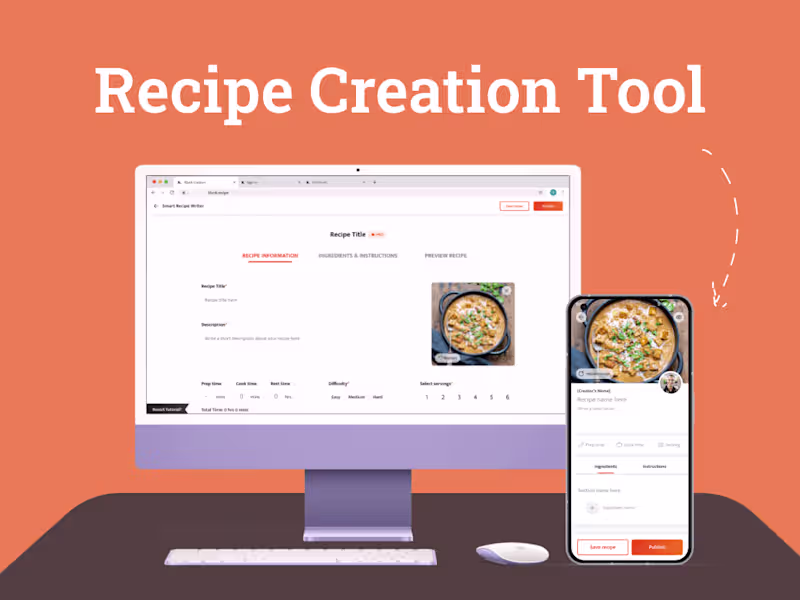
Explainer and Product Demo Video Maker
- $100k+
- Earned
- 21x
- Hired
- 5.0
- Rating
- 99
- Followers
Explainer and Product Demo Video Maker


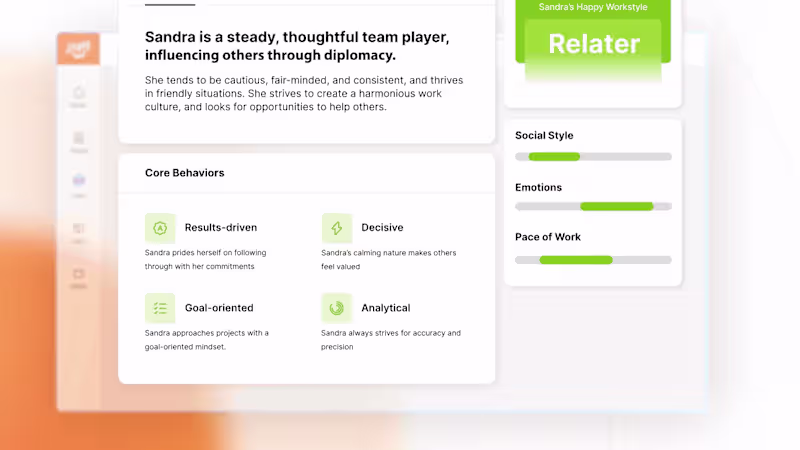

Transforming ideas into user-centered solutions
- 5.0
- Rating
- 1
- Followers
Transforming ideas into user-centered solutions


View more →
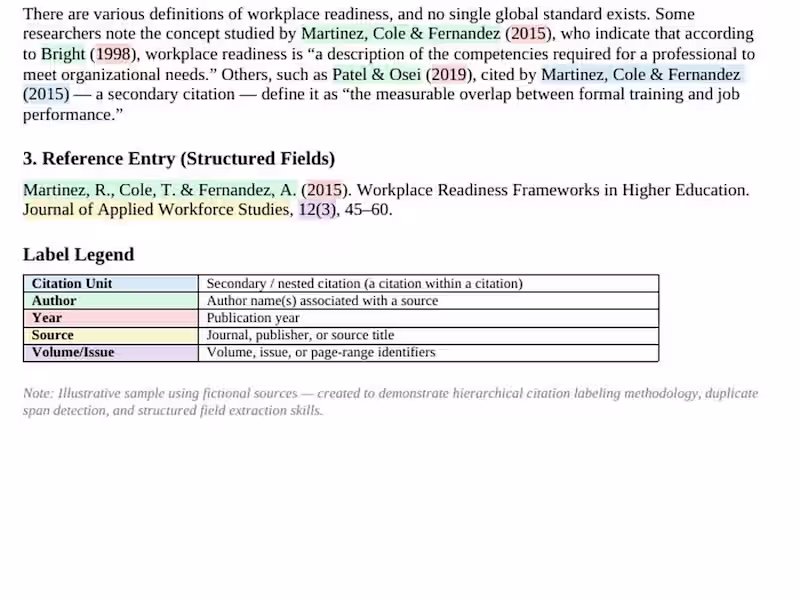
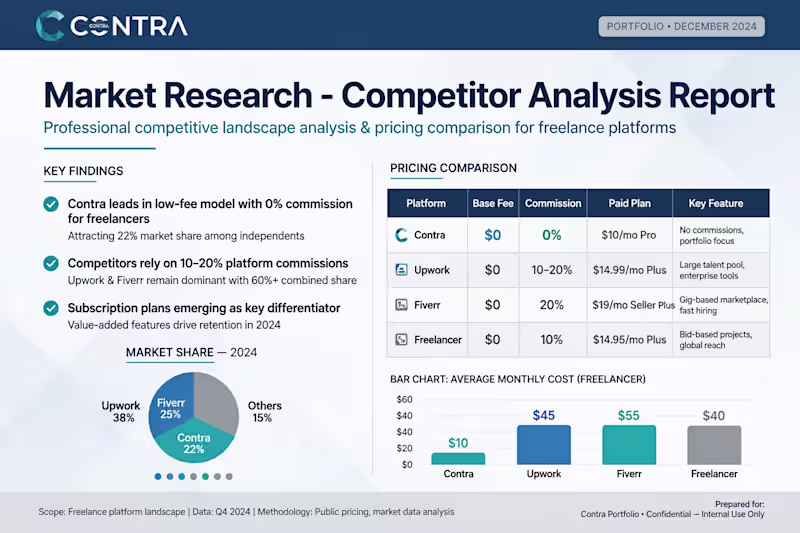
Business case studying,reviewing and Advising
Business case studying,reviewing and Advising


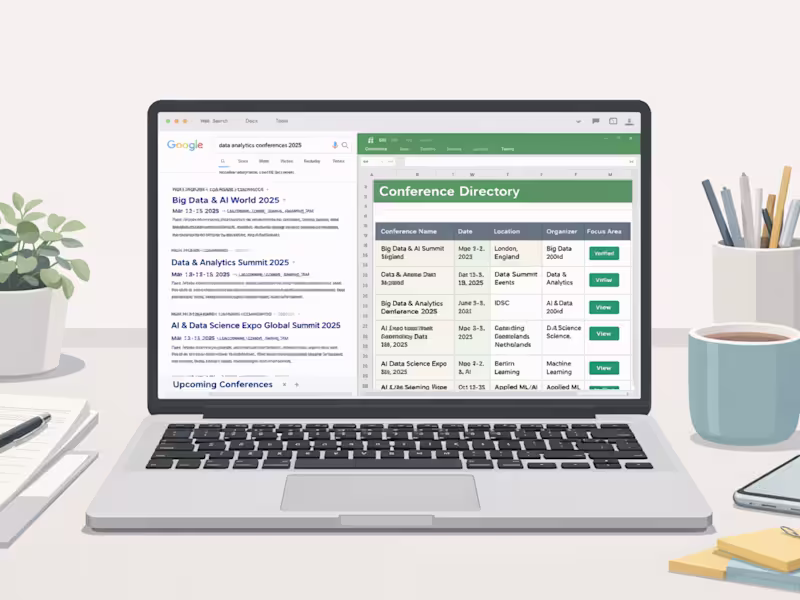
Data Analyst | SQL • Python • Excel • Power BI • Tableau
New to Contra
Data Analyst | SQL • Python • Excel • Power BI • Tableau

Remote VA & Web Designer | Relume + Project Support

Expert Flutter Developer for MVPs & Market Analysis
Expert Flutter Developer for MVPs & Market Analysis