Results that are similar to your search
Similar results
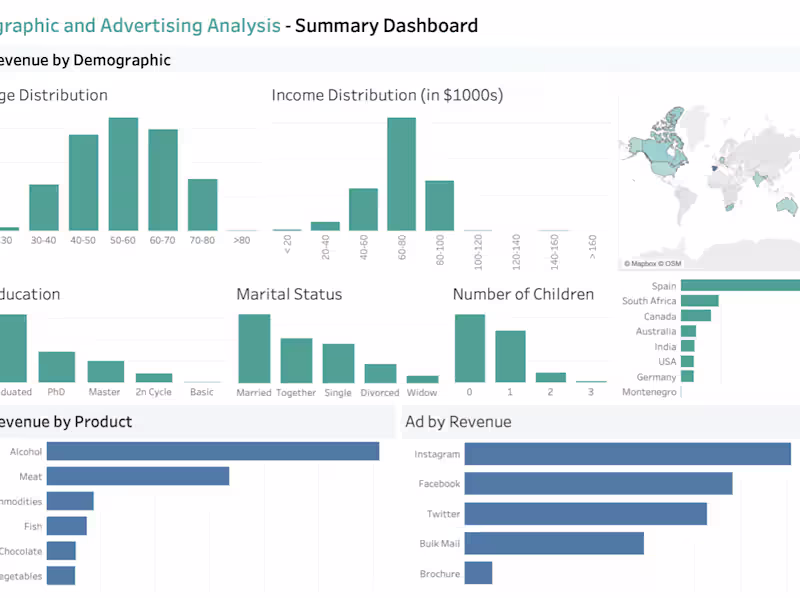
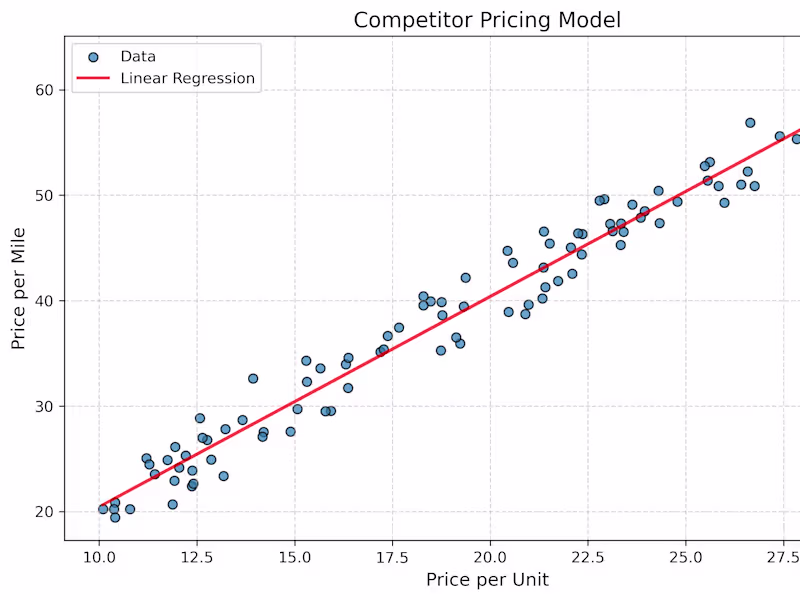
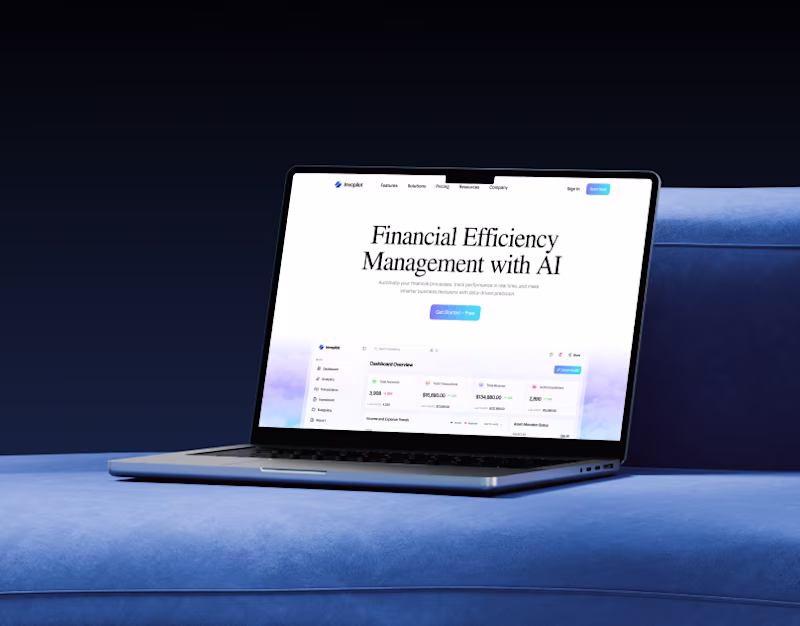
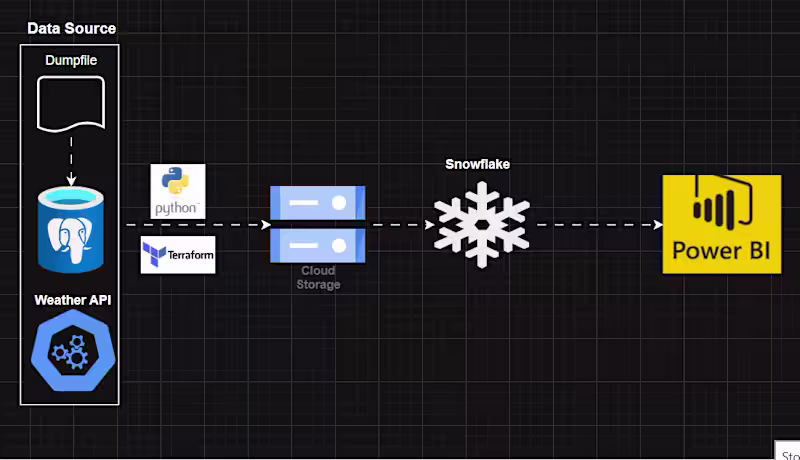
Data Engineering and Automation


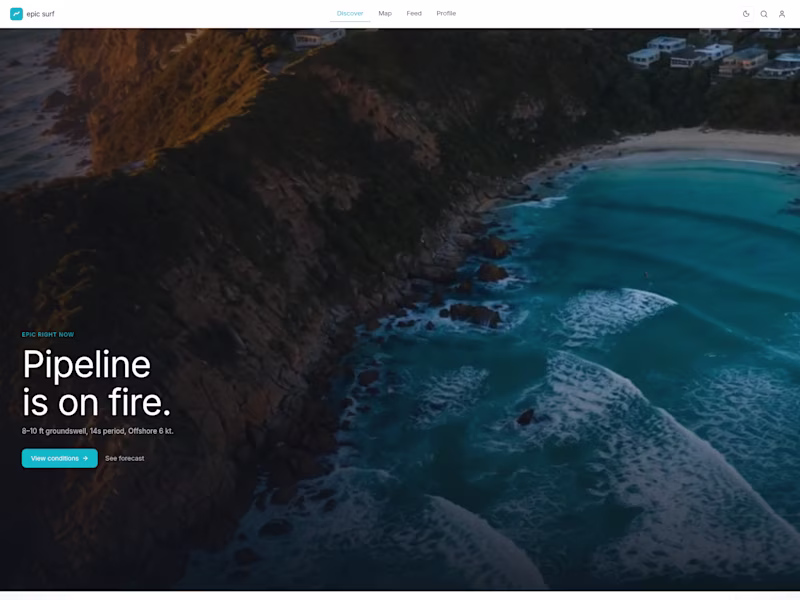
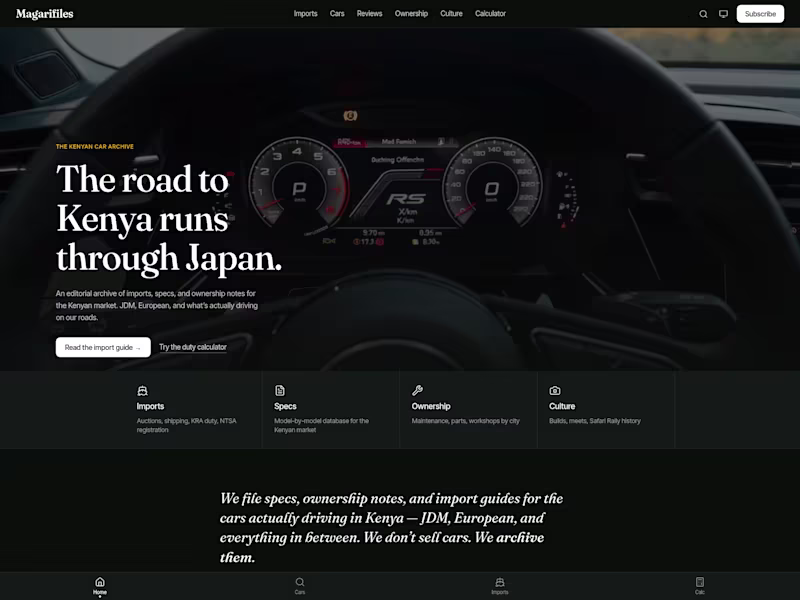
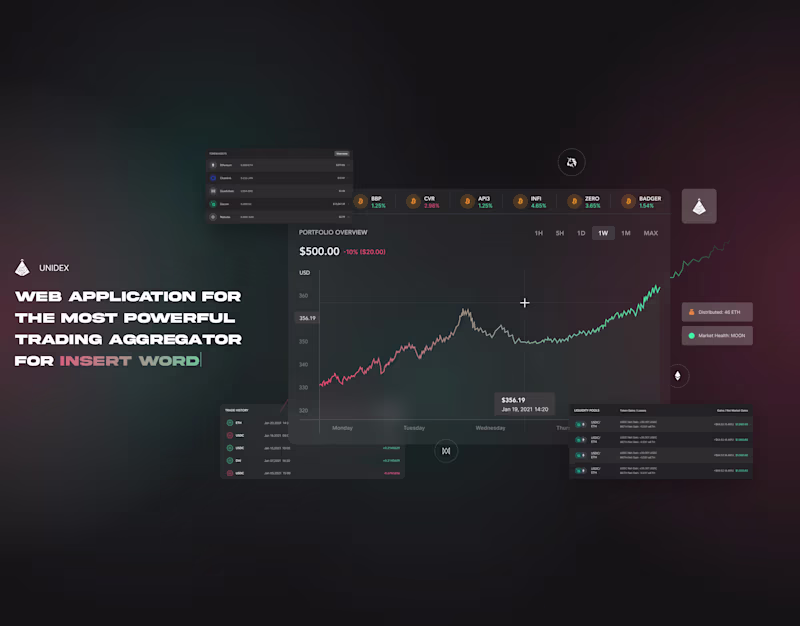
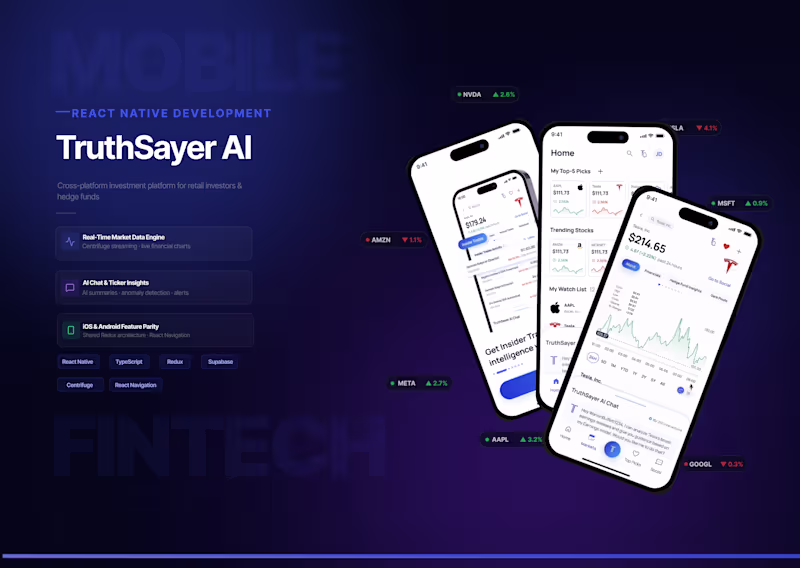
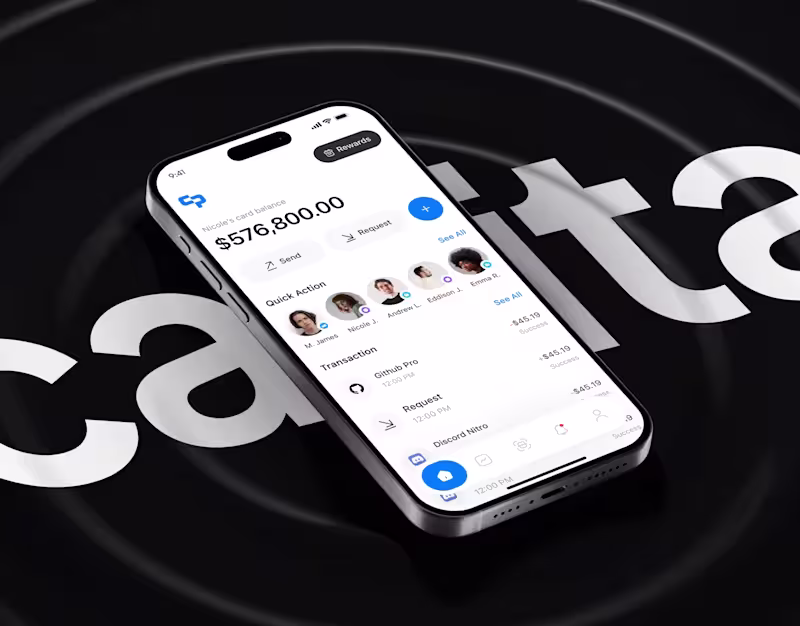
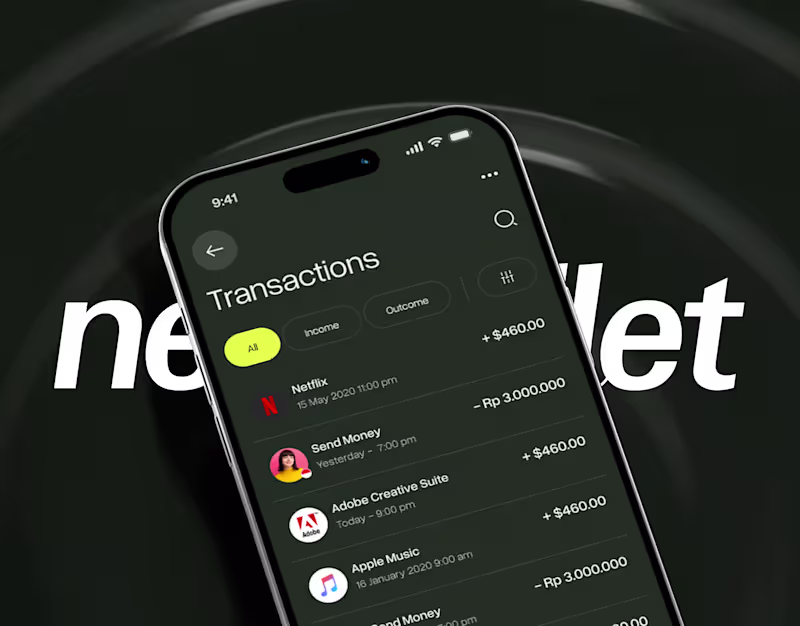
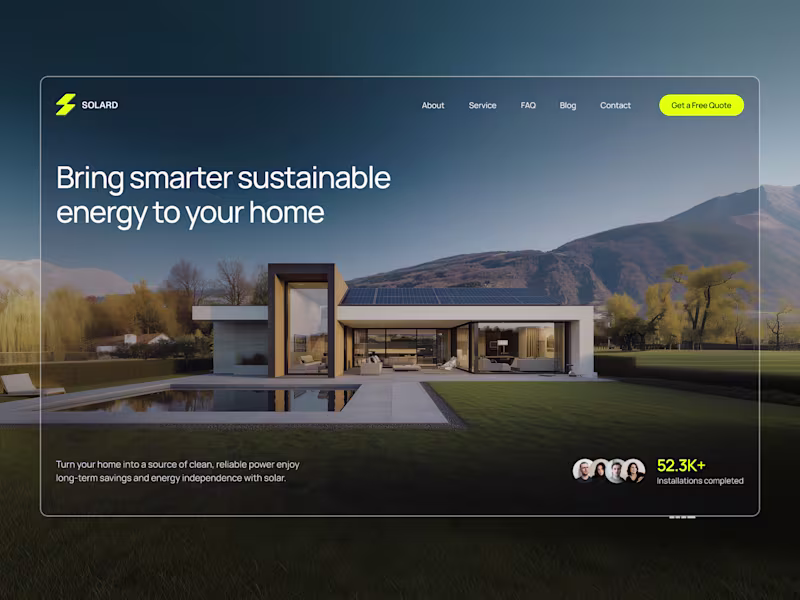
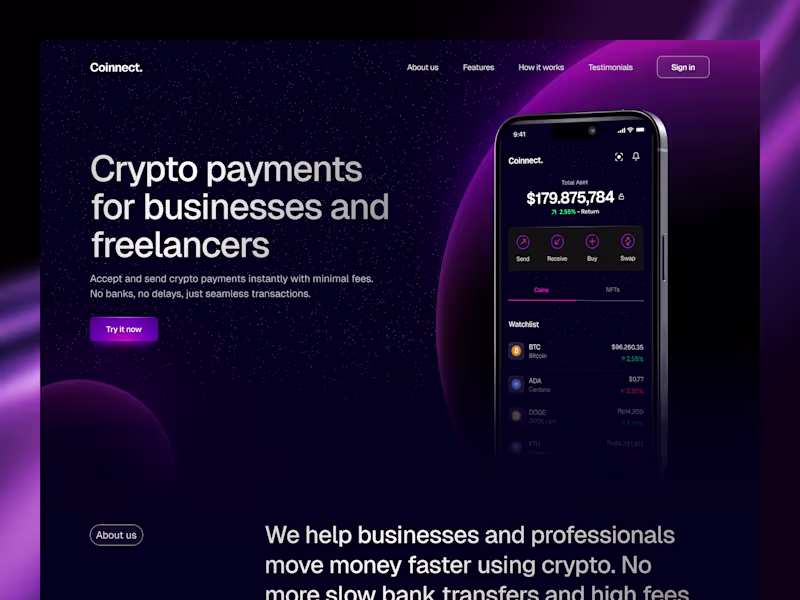
Turning your fintech and web3 ideas into shipped products
Turning your fintech and web3 ideas into shipped products
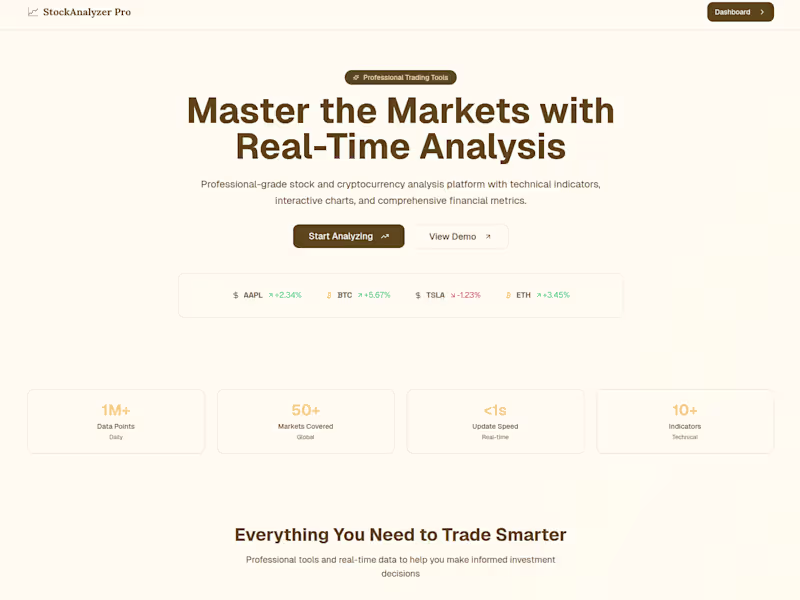
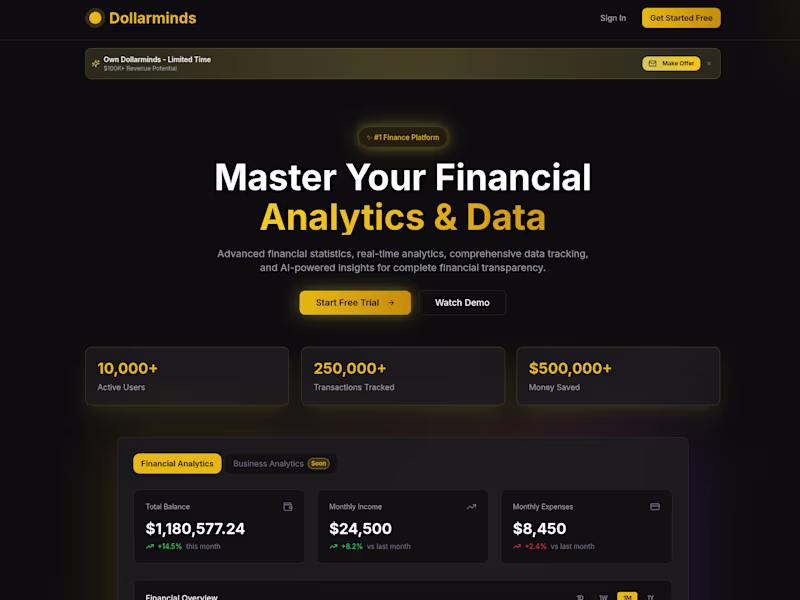
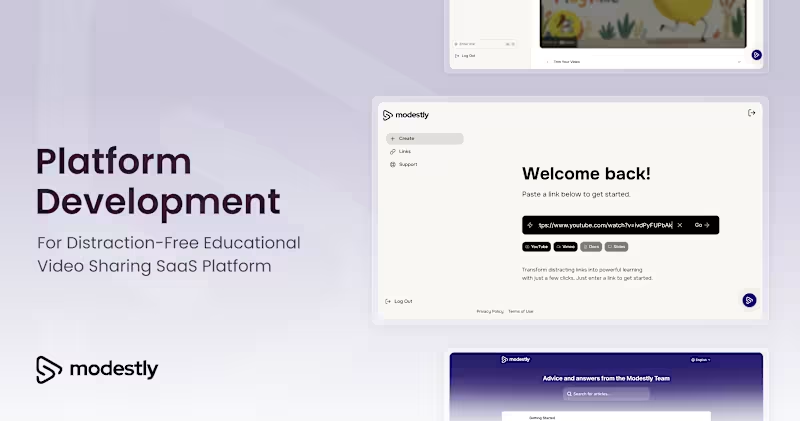
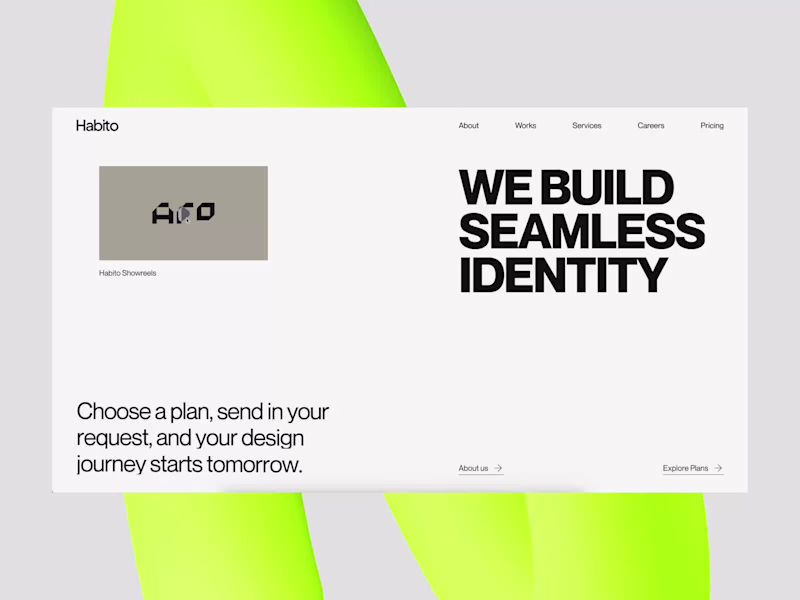
Custom Software Development & UI/UX Design
- $100k+
- Earned
- 4x
- Hired
- 11
- Followers
Custom Software Development & UI/UX Design

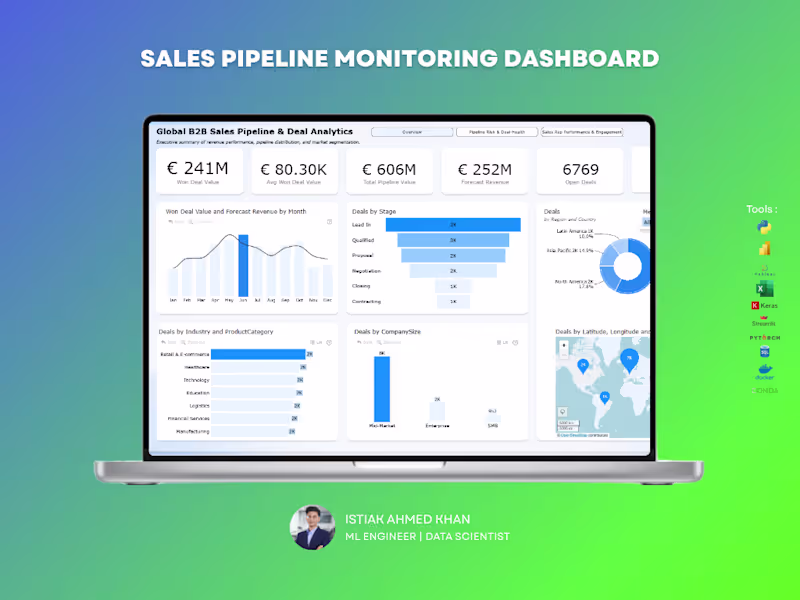
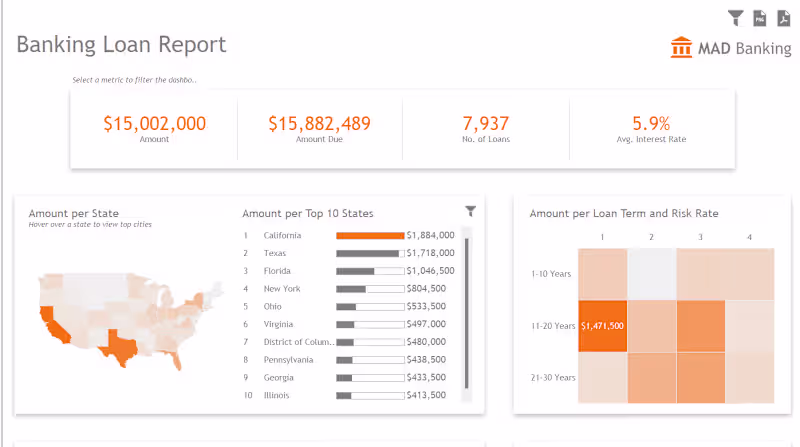
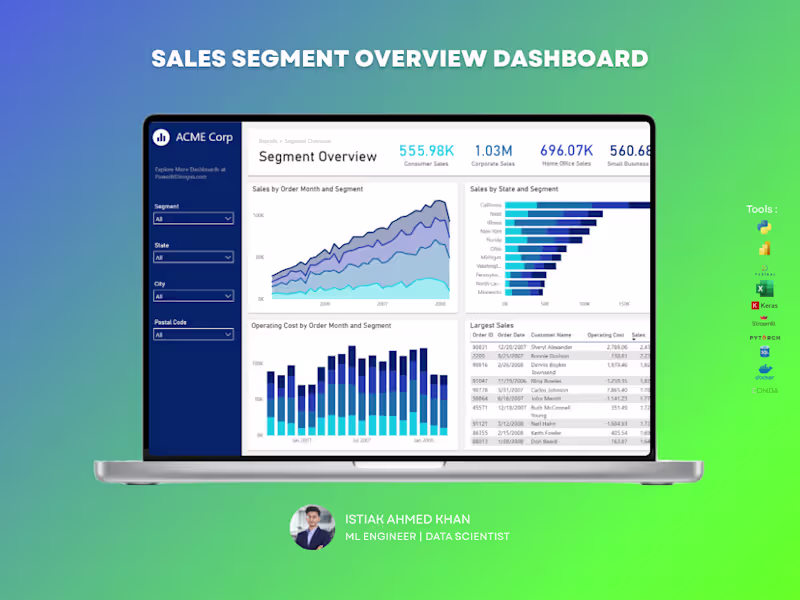
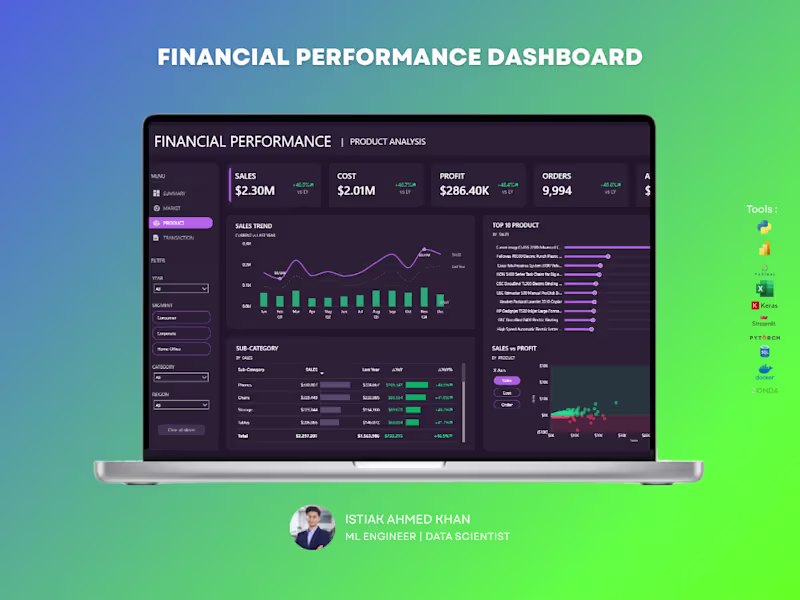
Power BI Data Analyst + ML AI Automation Expert
- 5.0
- Rating
- 100
- Followers
Power BI Data Analyst + ML AI Automation Expert
Designer and Creative Director
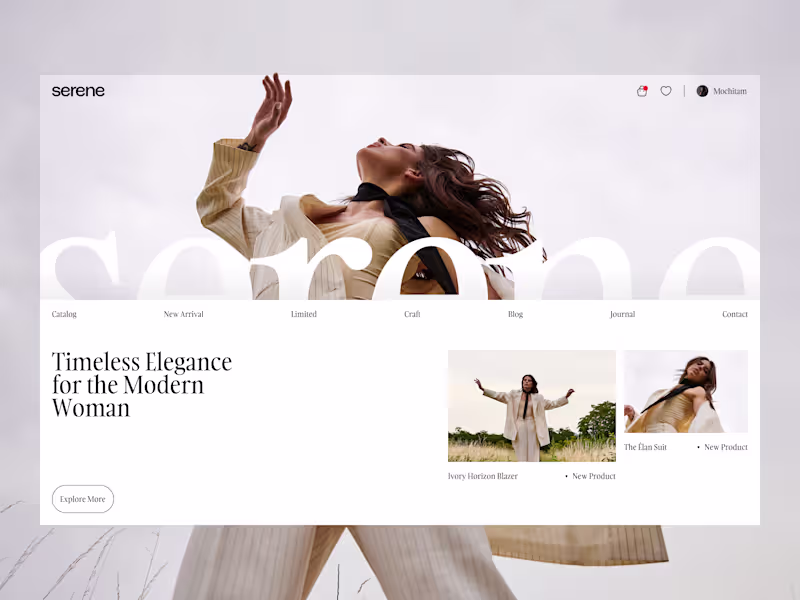
UI/UX Designer | Web designer
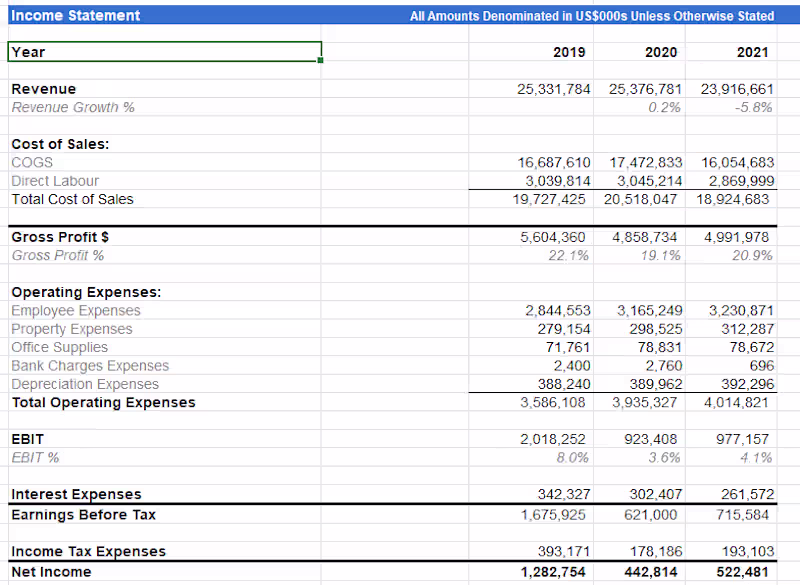
Professional Accountant | Bookkeeping, Financial Reporting
Delivering Value through Targeted Content