Data Modeling Projects in Delhi
Sign Up
Post a job
Sign Up
Log In
Filters
2
Projects
People
Message
1
Ajay Bidyarthy- AI Full Stack Developer
pro
I work with data analytics and machine learning to extract insights and build intelligent solutions. I design and develop interactive dashboards and data visualizations that make complex data easy to understand and act on.
1
254
Message
1
Vikas Kashyap
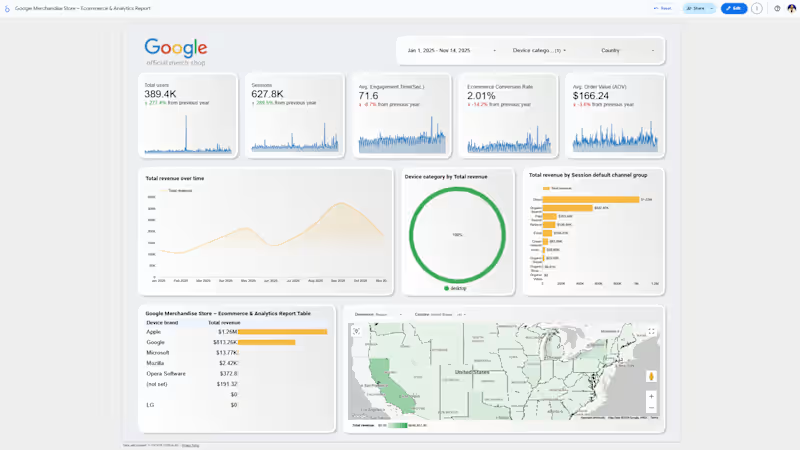
Executive Summary Dashboard for Google Merchandise Store
1
11
Message
0
Pranav Chauhan
TECHWEEK - AN IEEE PRODUCT
0
13
Message
0
mayank
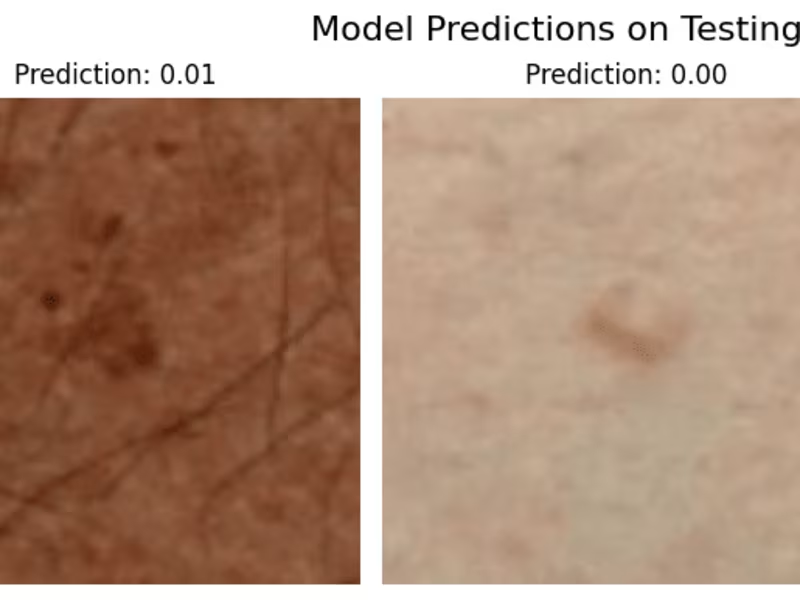
Skin Lesion Detection Using Convolutional Neural Networks – ISI…
0
19
Message
0
Saransh Purohit
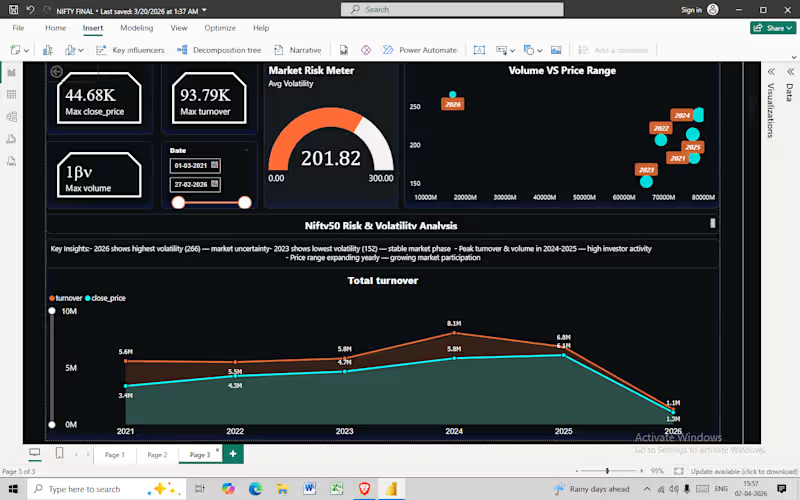
Risk management analysis
0
12
Message
0
himanshu gupta
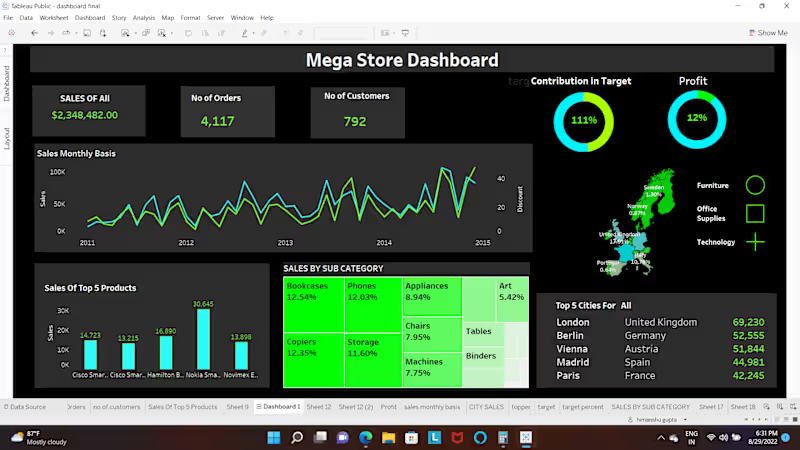
Mega Store Dashboard
0
1
Message
0
Poonam Kashyap
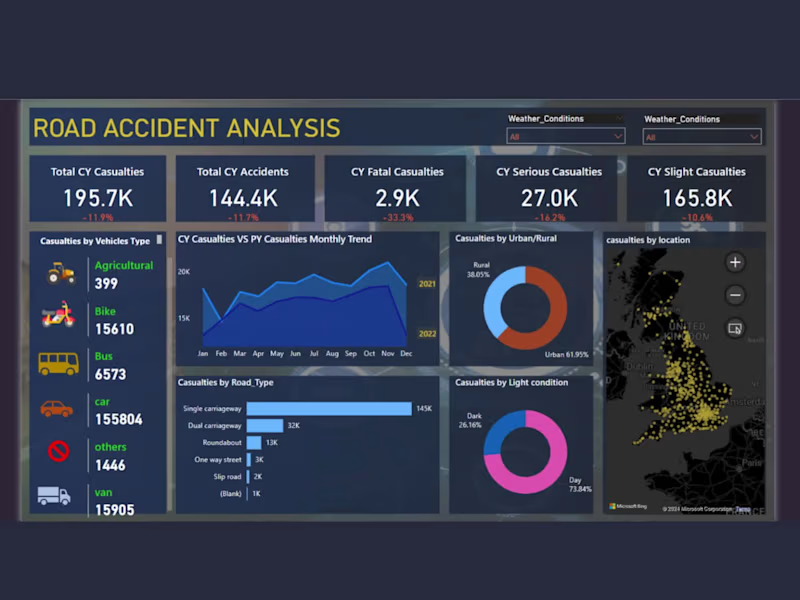
🚦 Road Accident Analysis Dashboard – Power BI Project This interactive Power BI dashboard provides a detailed analysis of road accidents across multiple regions, helping authorities and businesses identify key risk factors and improve road safety strategies. It offers a visual overview of accident frequency, causes, vehicle types involved, and casualty trends over time. 🔍 Key Insights & Features: Trend analysis by accident severity, location, and time period. Interactive filters to compare regions and vehicle categories. Visual KPIs highlighting total accidents, fatalities, and injury rates. Heatmaps showing accident hotspots for targeted interventions. This project demonstrates my ability to clean, model, and visualize large datasets using Power BI. Thanks!
0
59
Message
0
Victory Joseph
Project on NLP based on customers sentiment analysis
0
15
Message
0
Vanshika Gulati
Machine Learning models
0
1
Message
0
Mukesh Jaiswal
Mukesh Jaiswal on Instagram: ”#”
0
10
Message
0
Aashish Tiwari
Revitalized Data Analysis at Lenovo with Excel, Power BI and PPT
0
14
Message
0
Shubhra Mittal
Human-Face Detection System with OpenCV
0
0
Message
0
Umang Khanna
PowerBI, Excel , VBA, Power Platform Expert
0
17
Message
2
Vikas Kashyap
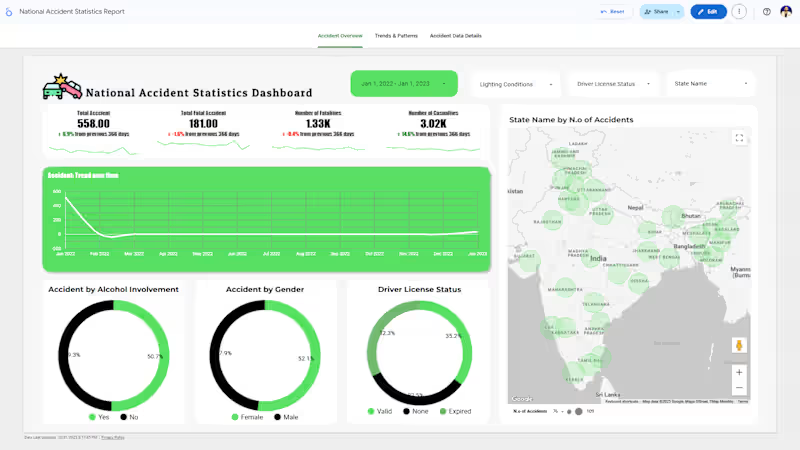
National Accident Statistics Dashboard in Google Looker Studio: I built an interactive Looker Studio dashboard using Google Sheets as the data source to visualize national accident statistics. The report analyzes accidents by region, time, severity, and demographics. A scheduled data re:fresh every 15 minutes keeps the dashboard updated in real time. As a Data Visualization Expert, I combined automation and design to deliver a clean, insightful, and dynamic Looker Studio dashboard for data-driven decision-making. 🎉 💯 🎉
2
149
Message
0
mayank
Comprehensive Stock Analysis and Prediction Using LSTM: A Case …
0
13
Message
0
himanshu gupta
Ind vs pak cricket rivalry dashboard on Excel #excel #IndvsPak …
0
0
Explore projects