Freelancers using SQL in Boston
Freelancers using SQL in Boston
Sign Up
Post a job
Sign Up
Log In
Filters
2
Projects
People
Jamie Tran
Boston, USA
Turning business data into clear reports & insights
New to Contra
Follow
Message
Turning business data into clear reports & insights
0
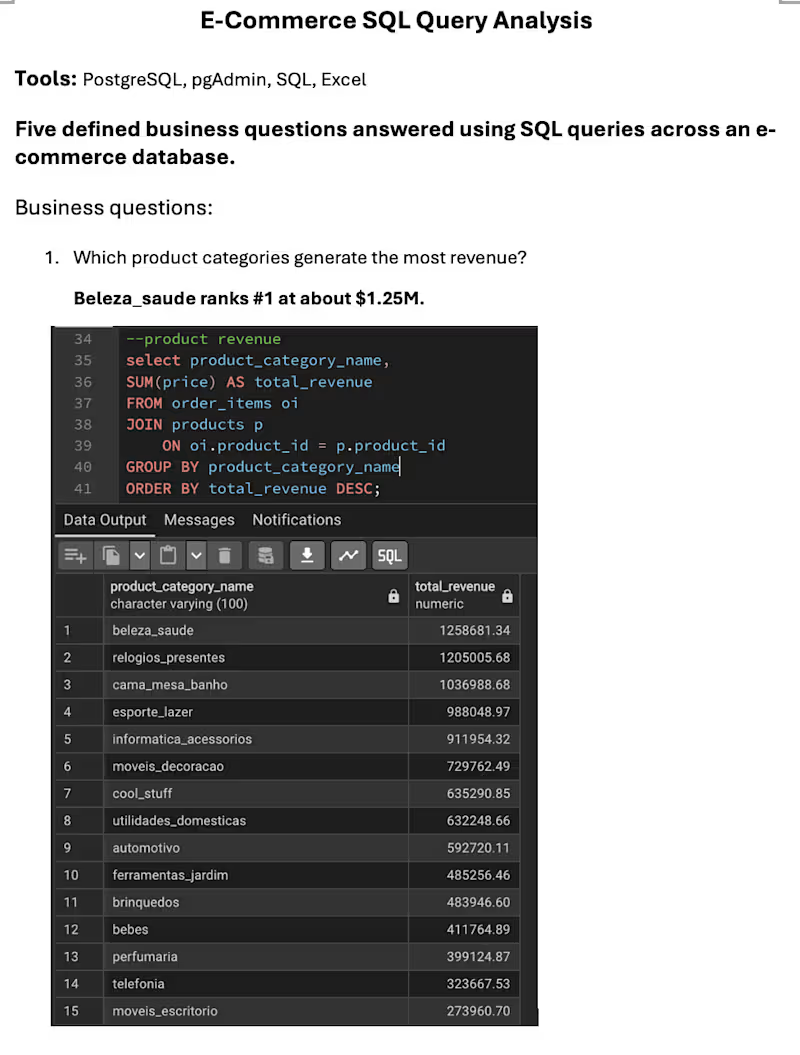
Used PostgreSQL to answer five defined business questions from an e-commerce database covering product performance, geographic revenue, repeat customers, seller performance, and delivery time. Each question was translated into a focused SQL query with the corresponding result and a clear, factual answer.
0
65
0
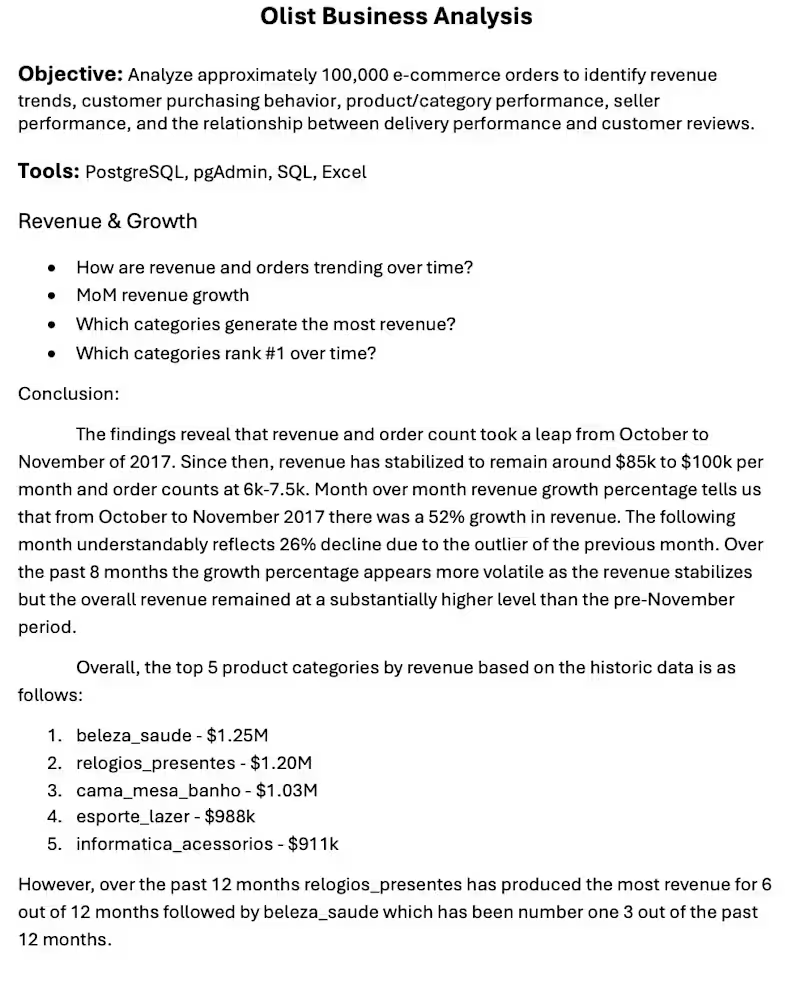
E-Commerce Business Analysis PostgreSQL • SQL • Business Analysis Overview Analyzed approximately 100,000 e-commerce orders using PostgreSQL to investigate revenue trends, customer behavior, product performance, seller performance, and delivery experience. What I Built I developed targeted SQL queries using joins, CTEs, aggregations, window functions, ranking, and date analysis to transform transactional data into business-focused findings. The analysis uncovered patterns in revenue growth, geographic performance, repeat purchasing, product categories, seller concentration, and the relationship between delivery performance and customer reviews. Key Findings Revenue increased substantially during the analyzed period • Repeat purchasing represented a relatively small share of customers • Revenue was not heavily concentrated among the top sellers • Longer delivery times were associated with substantially lower customer review scores Tools: PostgreSQL • SQL • pgAdmin • Excel Want to see the queries? View the complete SQL analysis on GitHub → https://github.com/jamietran8818/business-data-analytics-portfolio/blob/main/olist-sql-business-analysis/README.md
0
104
0
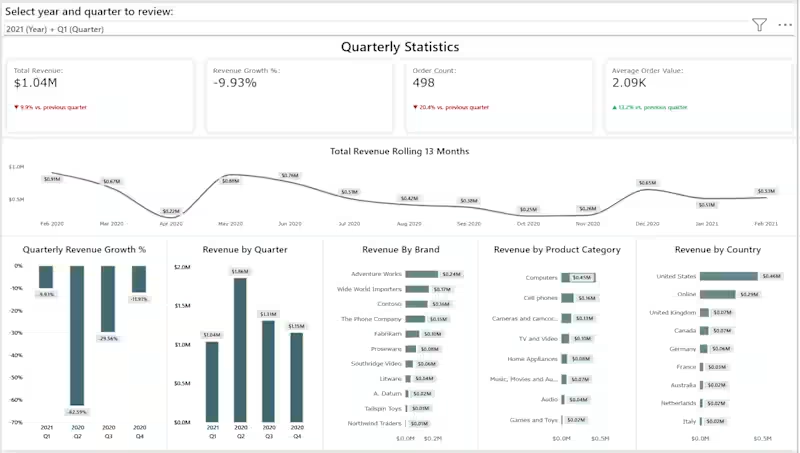
Developed a three-page Power BI reporting solution designed to provide both high-level performance monitoring and deeper business analysis. The report includes an executive overview alongside dedicated revenue and product analysis pages, allowing users to track key KPIs, evaluate trends and period-over-period performance, and explore results across products and other business dimensions. Interactive filtering and drill-down functionality make it easy to move from summary-level reporting into more detailed analysis.
0
40
0
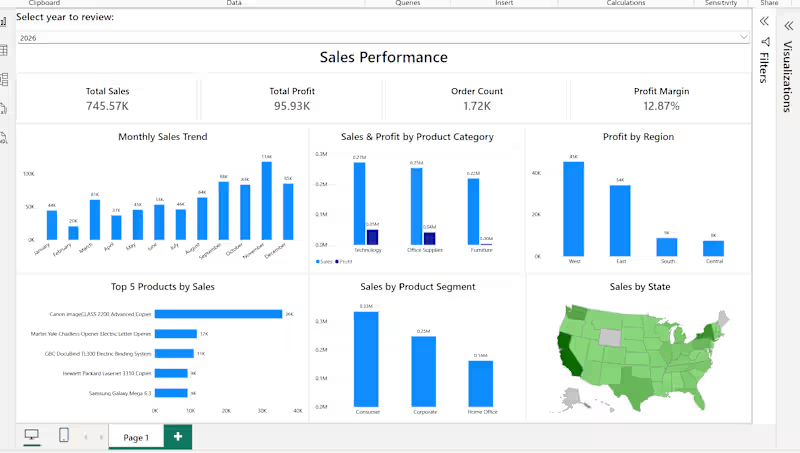
Developed an interactive one-page Power BI dashboard for monitoring retail sales performance. The report combines key KPIs with monthly trends and analysis across product categories, regions, customer segments, top products, and geographic markets. Interactive filtering allows users to quickly explore performance by year and other business dimensions.
0
65
SQL
(2)
Follow
Message
Andrew Christo
Boston, USA
Data-Driven Growth Expert 📈💡
Follow
Message
Data-Driven Growth Expert 📈💡
0
Email Marketing Program for Call Center
0
22
0
Custom Inventory Analytics Platform
0
5
0
Designing and implementing a custom Gen-AI solution
0
3
View more →
SQL
(2)
Follow
Message
Shawn Doherty
Boston, USA
Expert in In-Depth Business Research & Academic Writing
Follow
Message
Expert in In-Depth Business Research & Academic Writing
0
HKIA Sustainability Report 2017/18 (Sample)
0
31
0
Clinical Virtual Simulation
0
28
0
Bubble Tea Consumer Psychology
0
35
0
Massage Therapy for Chronic Fatigue Syndrome
0
36
SQL
(1)
Follow
Message
Explore people