The network for creativity
Join 1.25M professional creatives like you
Connect with clients, get discovered, and run your business 100% commission-free
Creatives on Contra have earned over $150M and we are just getting started
Back to feedPost

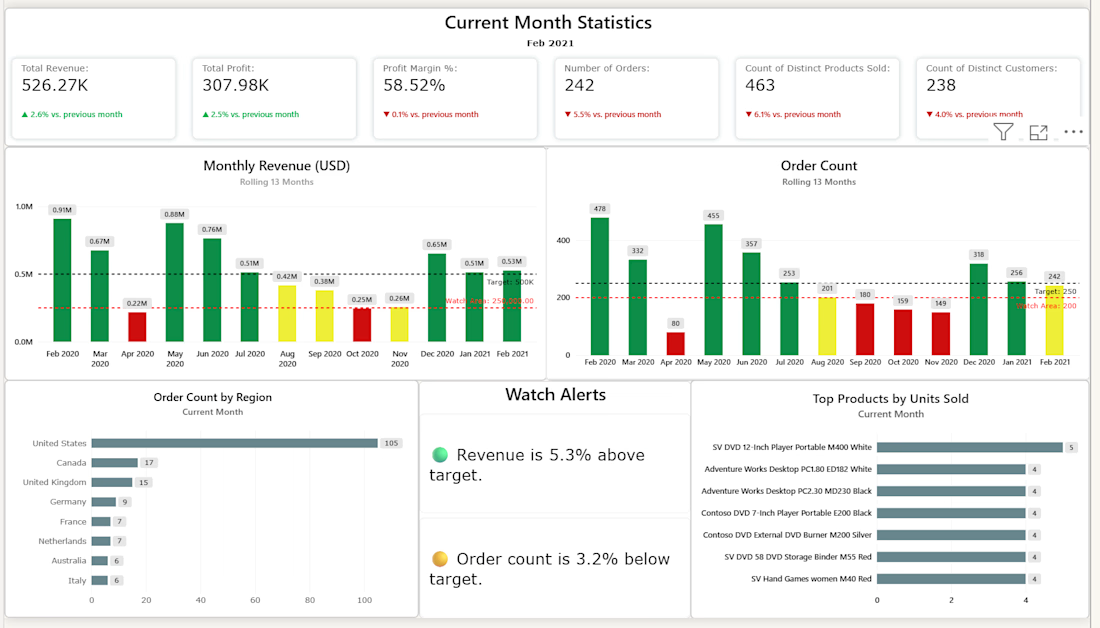
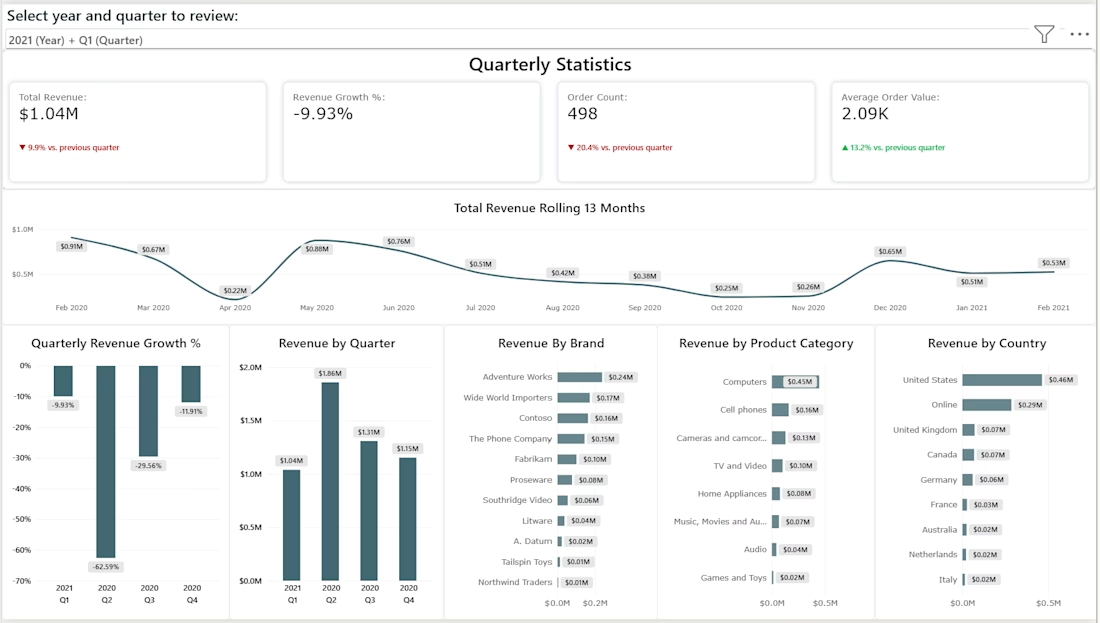
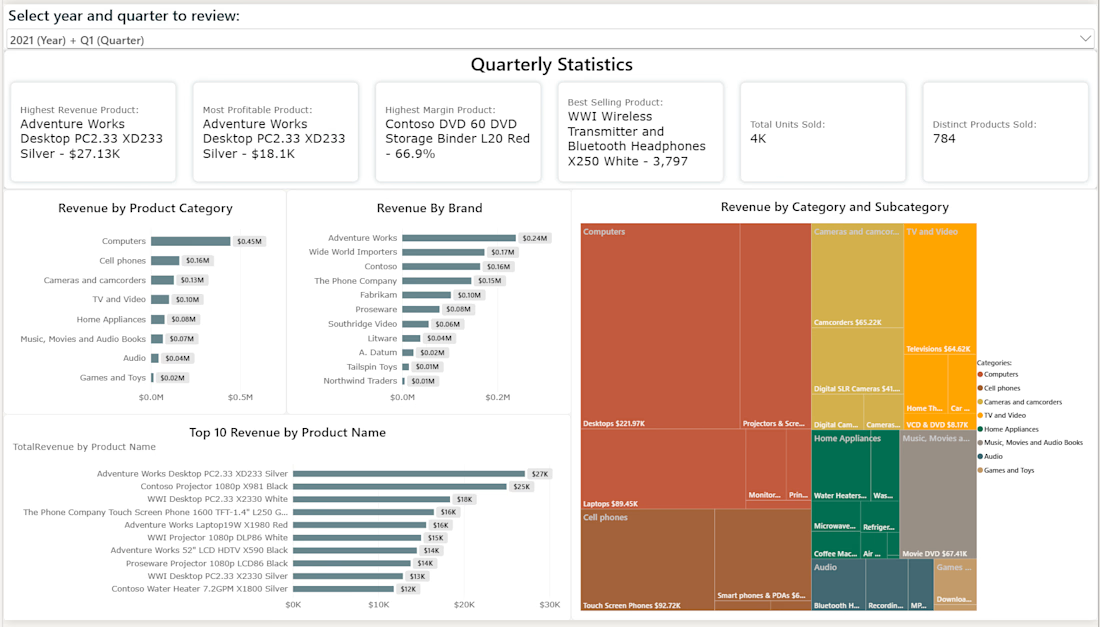
Developed a three-page Power BI reporting solution designed to provide both high-level performance monitoring and deeper business analysis. The report includes an executive overview alongside dedicated revenue and product analysis pages, allowing users to track key KPIs, evaluate trends and period-over-period performance, and explore results across products and other business dimensions. Interactive filtering and drill-down functionality make it easy to move from summary-level reporting into more detailed analysis.

The network for creativity
Join 1.25M professional creatives like you
Connect with clients, get discovered, and run your business 100% commission-free
Creatives on Contra have earned over $150M and we are just getting started





Related posts

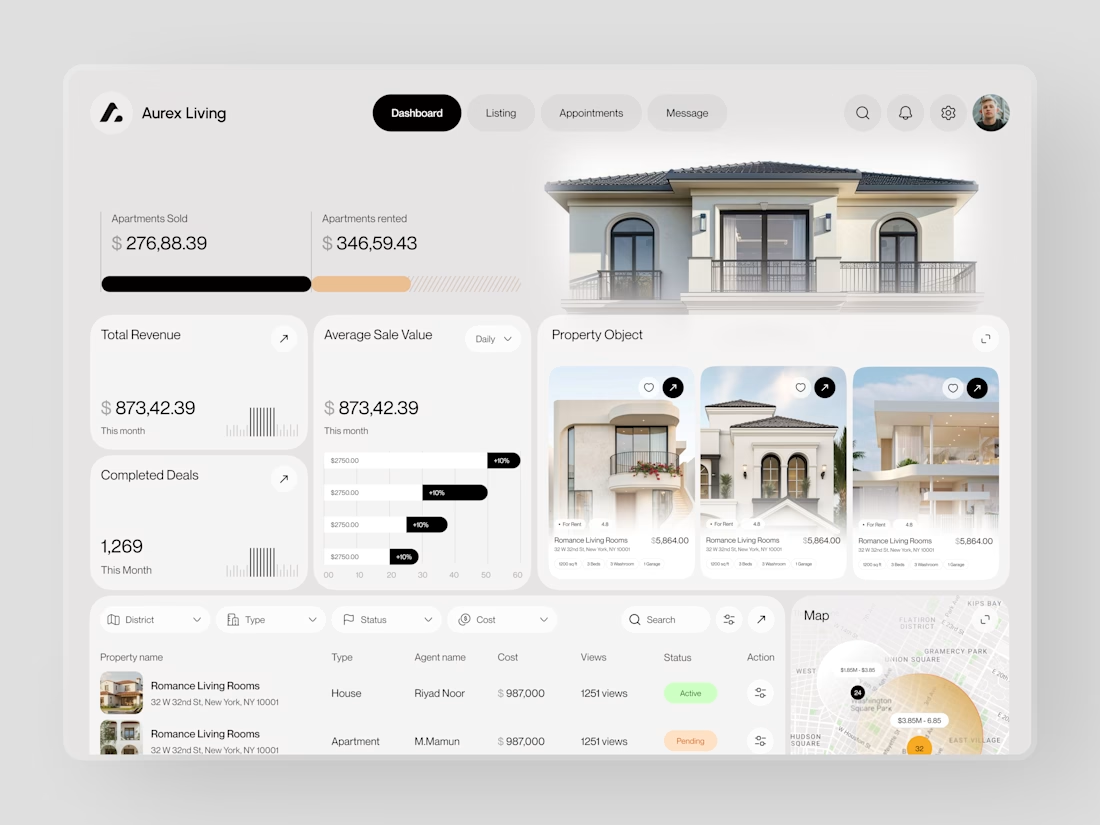
Real estate dashboards are usually built for data entry. Aurex Living was built for decision-making.
$873,42.39 total revenue. 1,269 completed deals this month. $276K sold, $346K rented. Property cards, agent tracking, map view, average sale value trending +10% - every number a real estate operator actually needs, on one clean white canvas.


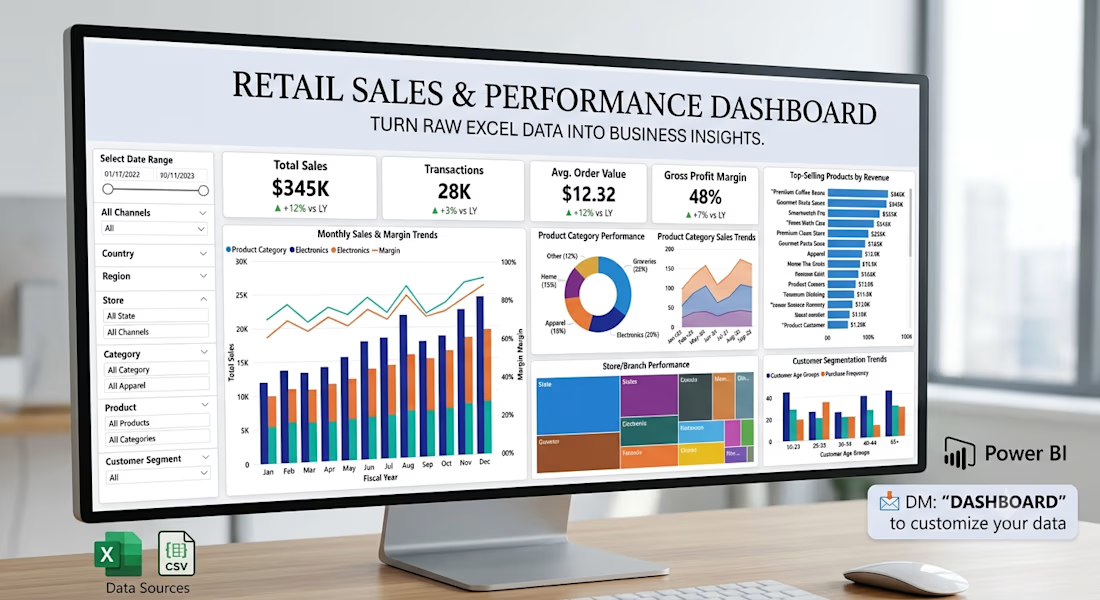
📊 Turn Your Excel Data Into a Clear Business Dashboard
Still managing your business reports in Excel and spending hours trying to understand your numbers?
I help small businesses turn their existing Excel/CSV data into simple, interactive Power BI dashboards.
With a dashboard, you can quickly track:
• 📈 Sales performance
• 🏆 Top-selling products
• 👥 Customer trends
• 🏪 Store/branch performance
• 📦 Product performance
• 🎯 KPIs and monthly targets
I recently built a retail analytics dashboard using Power BI, with data cleaning and transformation using Excel/Power Query.
I'm currently looking to work with small businesses, retailers, and growing teams that want their data to be easier to understand and use.
💬 If you already maintain your business data in Excel, feel free to message me. I'd be happy to show you what a dashboard could look like for your business.



Sales Dashboard - Excel to Tableau in 48 Hours