
Jamie Tran
Turning business data into clear reports & insights
New to Contra
Jamie is building their profile!


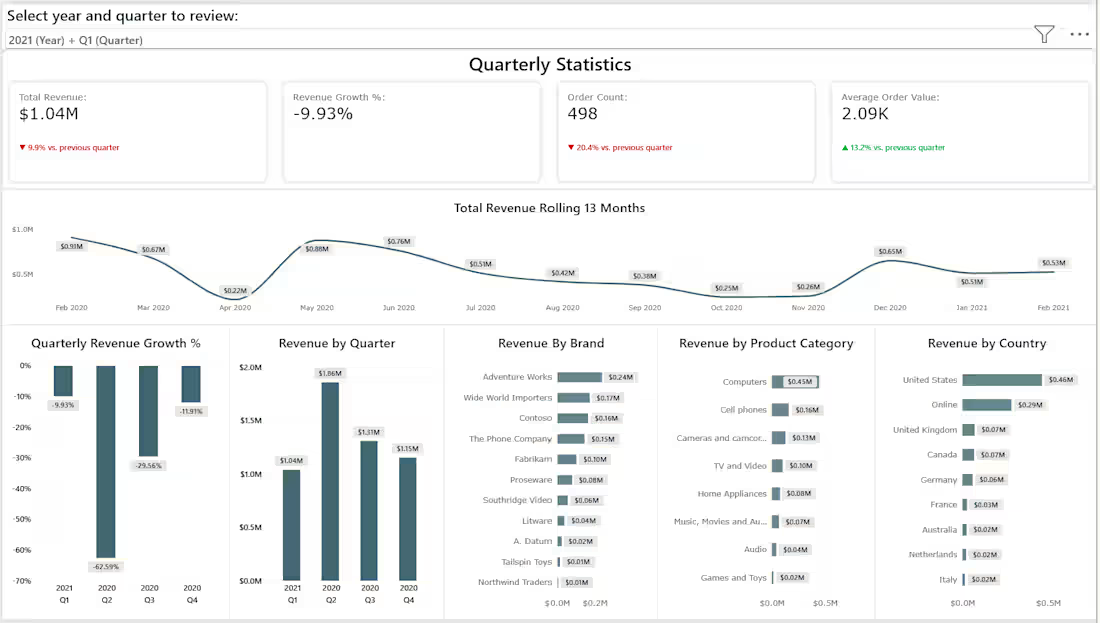
Developed a three-page Power BI reporting solution designed to provide both high-level performance monitoring and deeper business analysis. The report includes an executive overview alongside dedicated revenue and product analysis pages, allowing users to track key KPIs, evaluate trends and period-over-period performance, and explore results across products and other business dimensions. Interactive filtering and drill-down functionality make it easy to move from summary-level reporting into more detailed analysis.
0
11
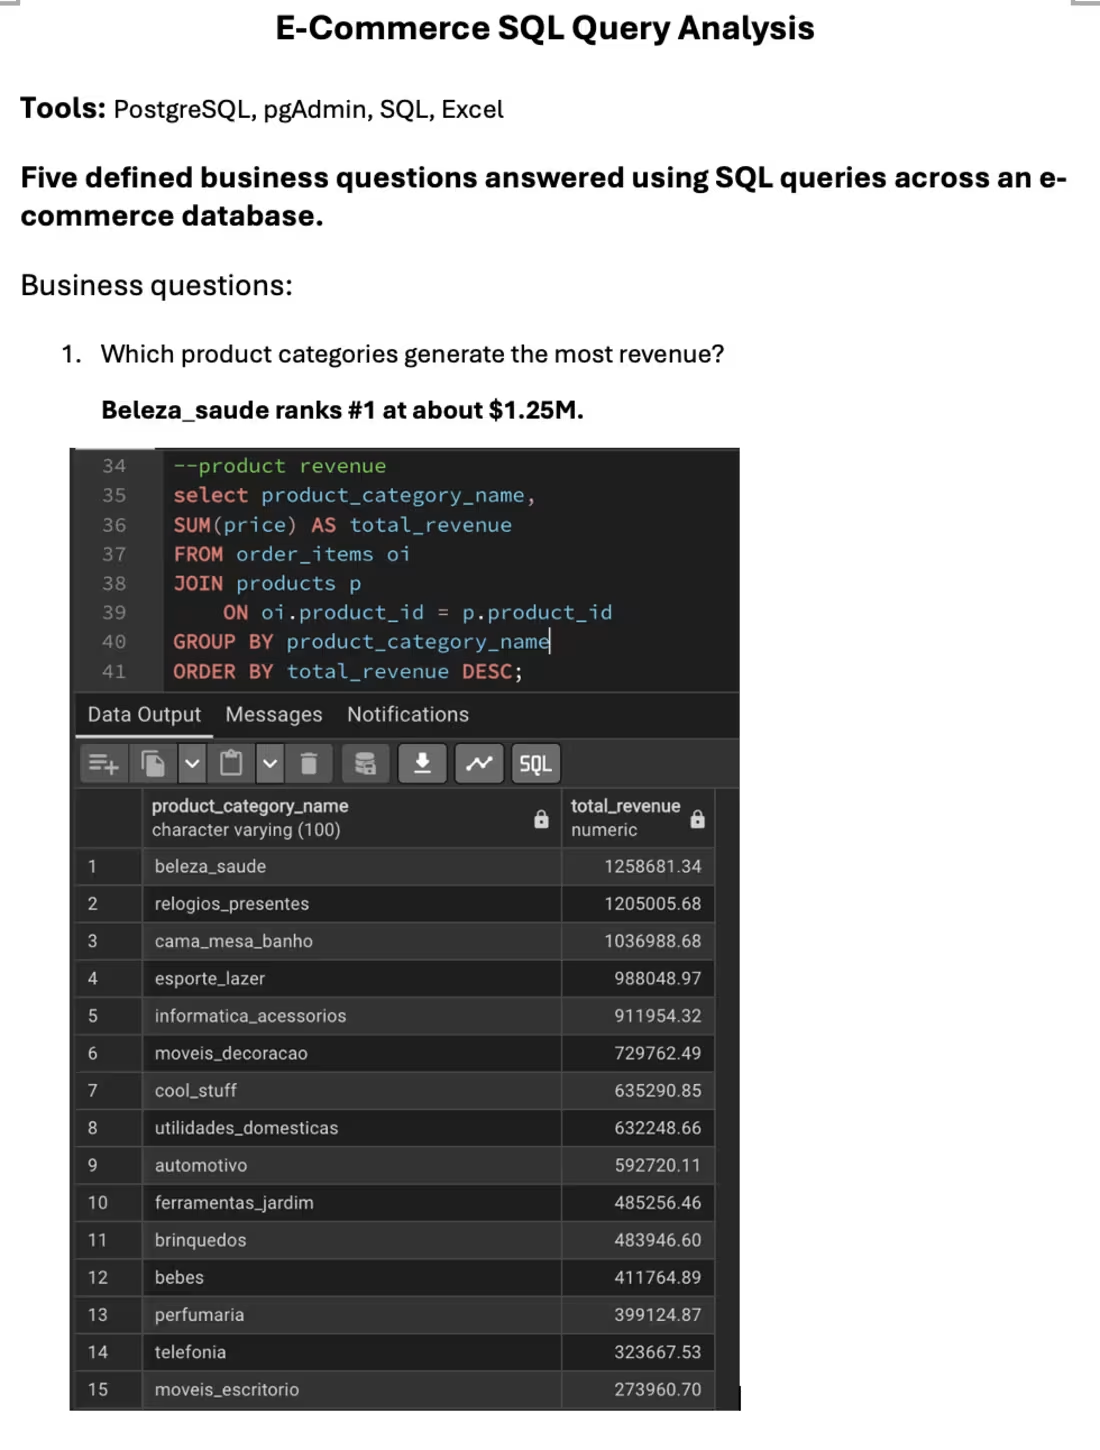
Used PostgreSQL to answer five defined business questions from an e-commerce database covering product performance, geographic revenue, repeat customers, seller performance, and delivery time. Each question was translated into a focused SQL query with the corresponding result and a clear, factual answer.
0
28
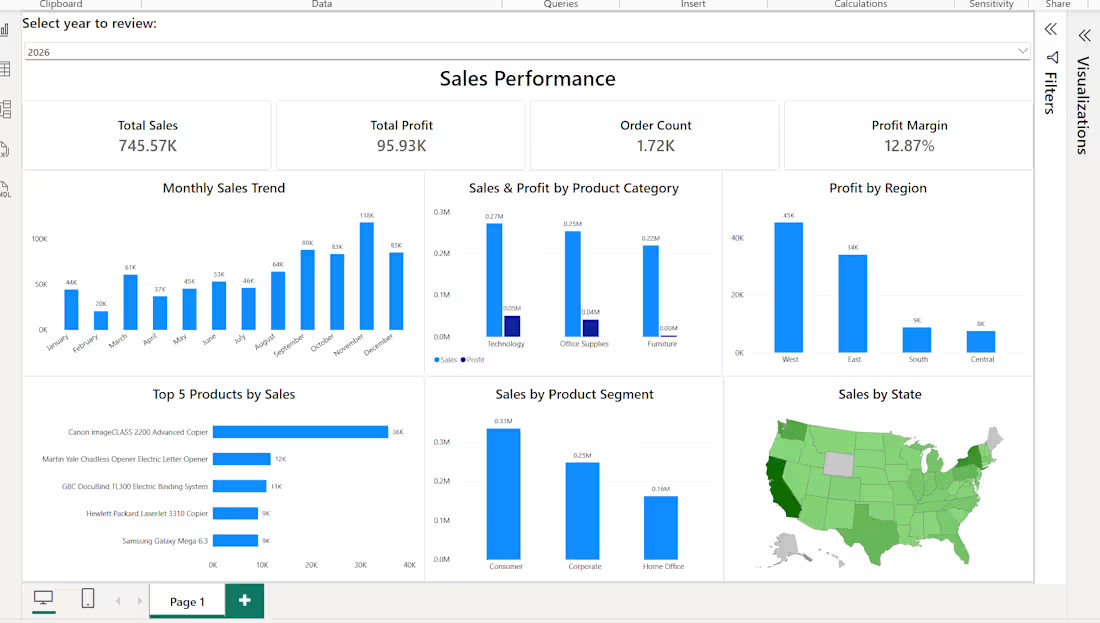
Developed an interactive one-page Power BI dashboard for monitoring retail sales performance. The report combines key KPIs with monthly trends and analysis across product categories, regions, customer segments, top products, and geographic markets. Interactive filtering allows users to quickly explore performance by year and other business dimensions.
0
31
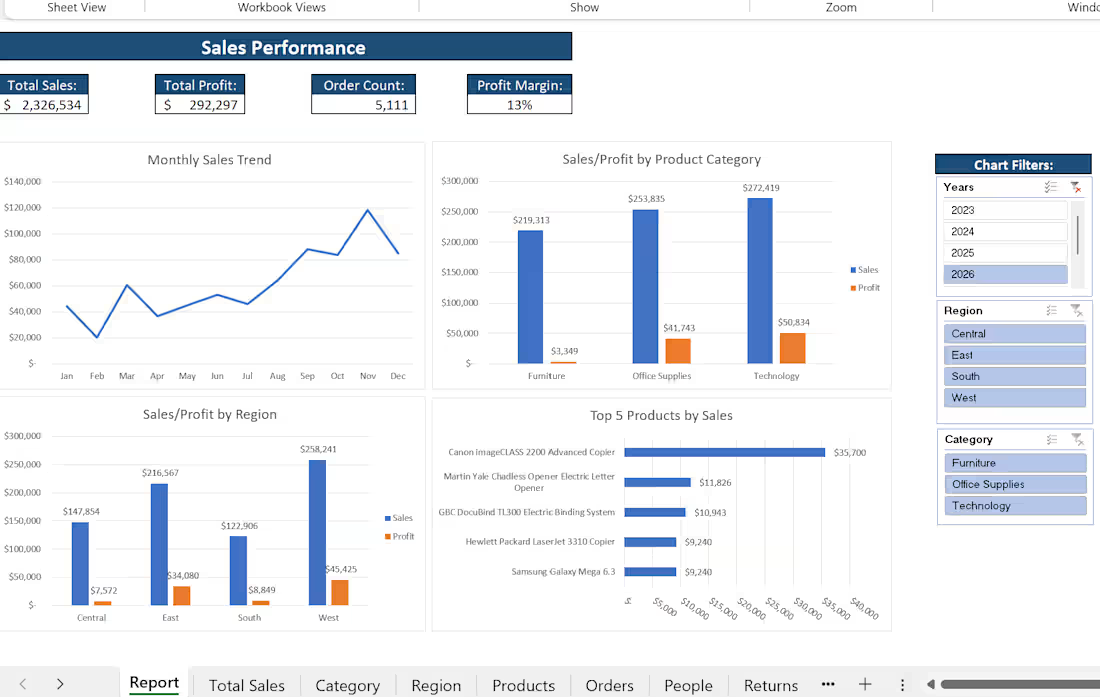
Built a one-page Excel dashboard to turn structured retail sales data into a clear management reporting tool. The dashboard provides key performance metrics including sales, profit, order volume, and profit margin, alongside monthly trends and analysis by product category, region, and top-selling products. Interactive filters allow users to explore performance across different areas of the business.
0
32