The network for creativity
Join 1.25M professional creatives like you
Connect with clients, get discovered, and run your business 100% commission-free
Creatives on Contra have earned over $150M and we are just getting started
Back to feedPost

E-Commerce Business Analysis
PostgreSQL • SQL • Business Analysis
Overview
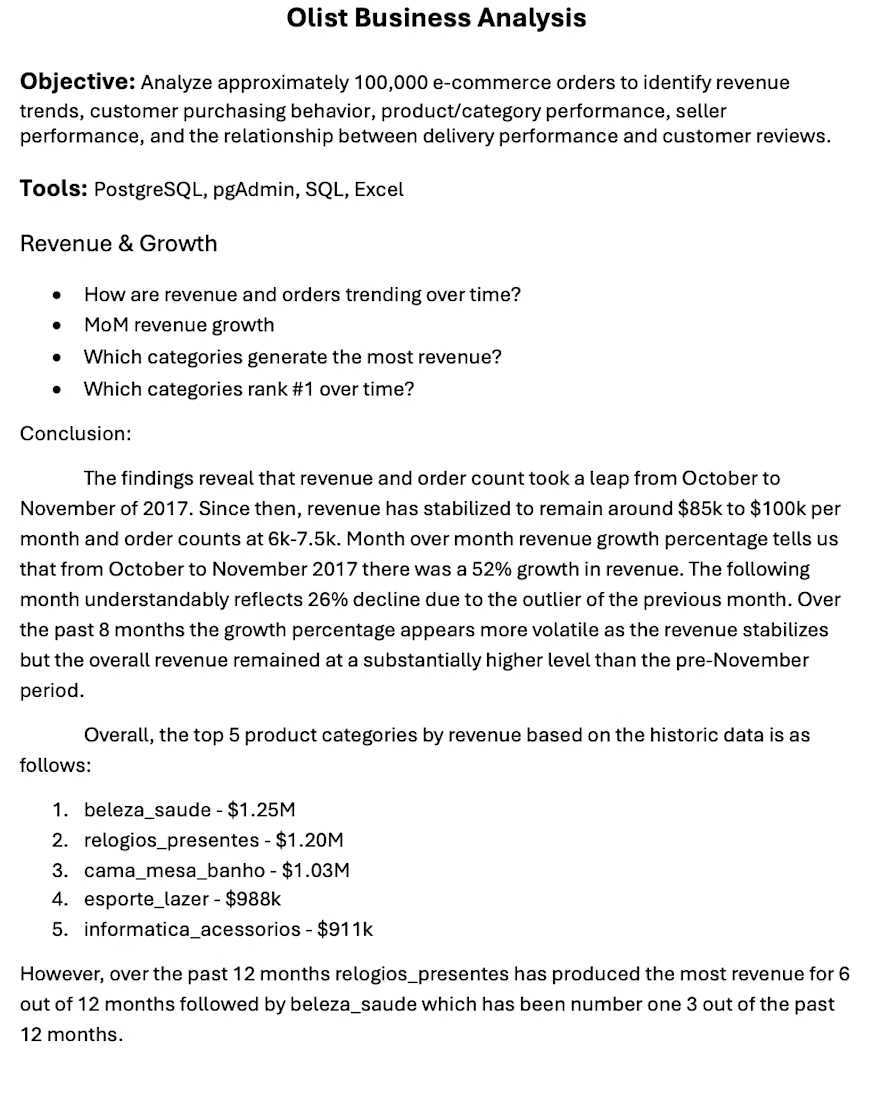
Analyzed approximately 100,000 e-commerce orders using PostgreSQL to investigate revenue trends, customer behavior, product performance, seller performance, and delivery experience.
What I Built
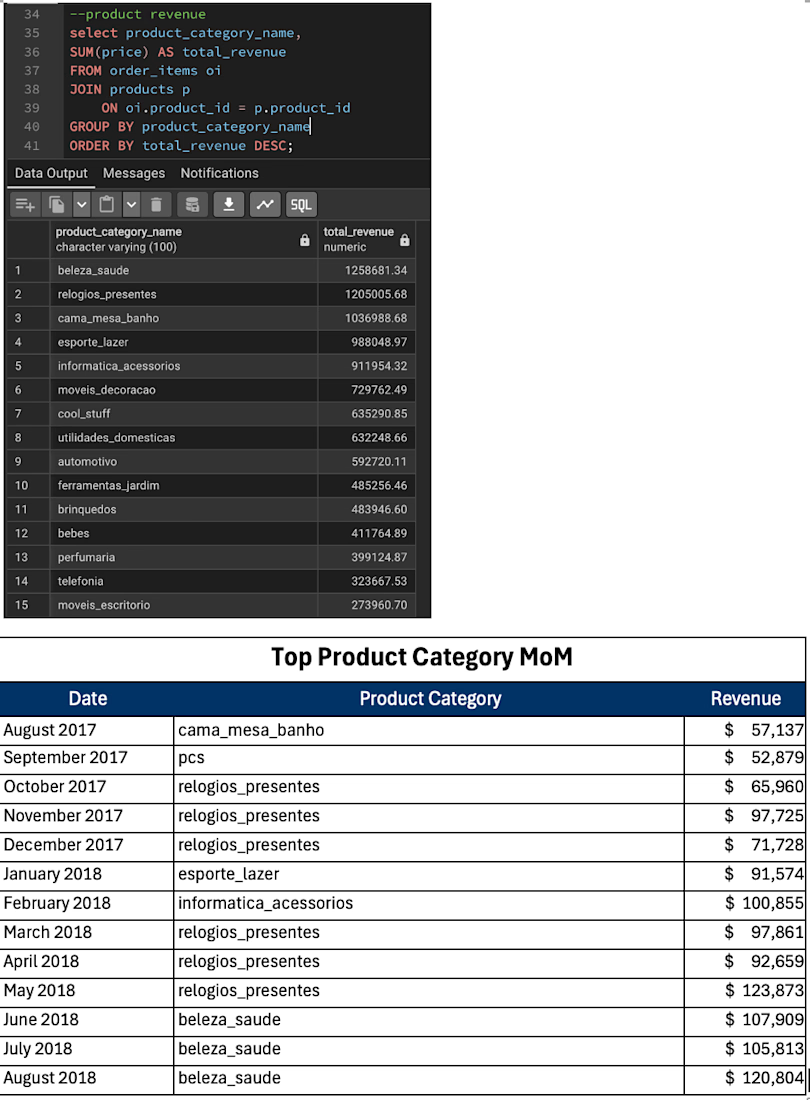
I developed targeted SQL queries using joins, CTEs, aggregations, window functions, ranking, and date analysis to transform transactional data into business-focused findings.
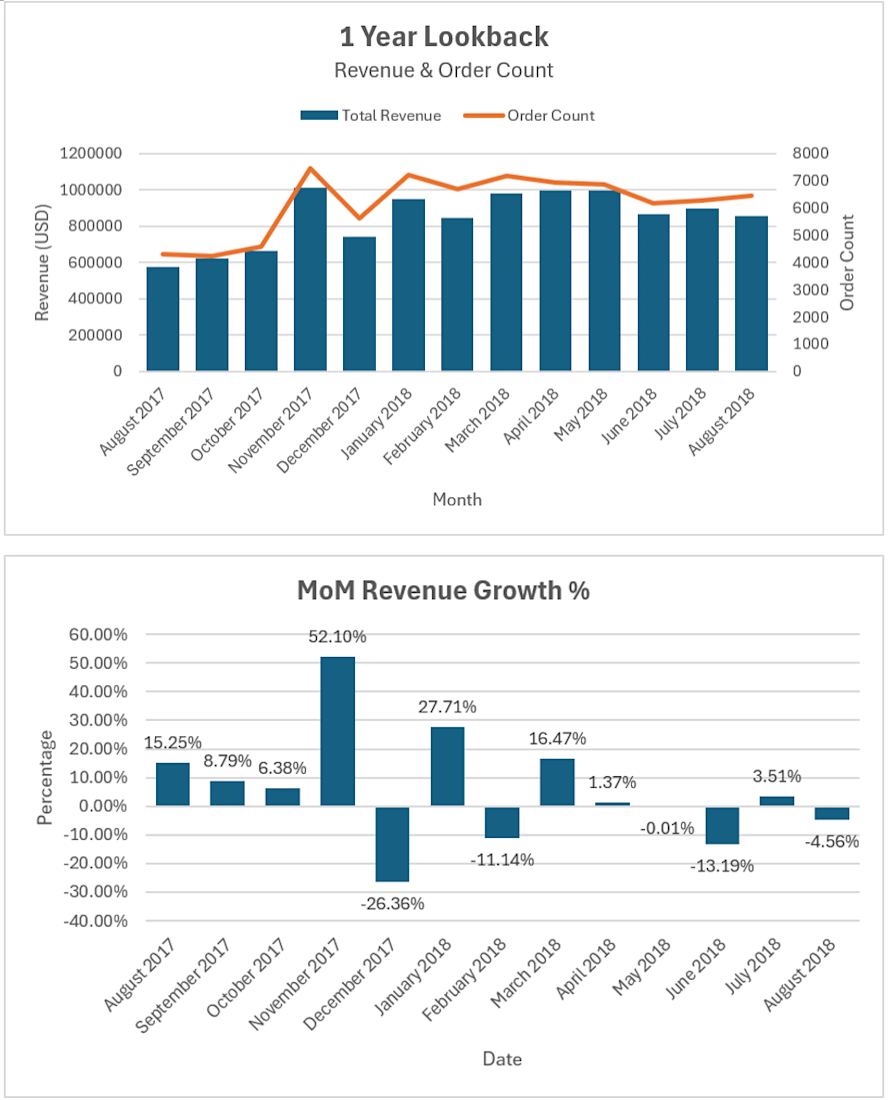
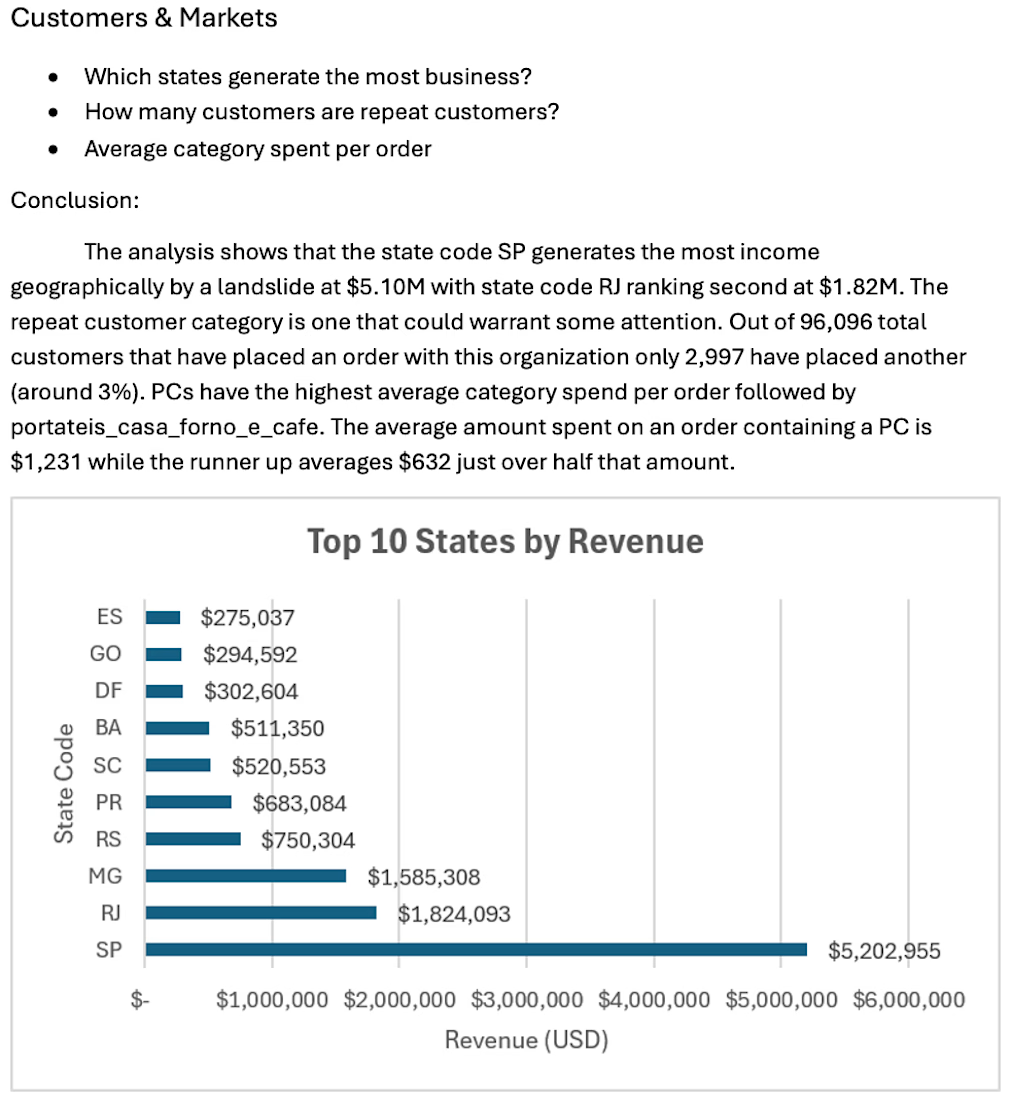
The analysis uncovered patterns in revenue growth, geographic performance, repeat purchasing, product categories, seller concentration, and the relationship between delivery performance and customer reviews.
Key Findings
Revenue increased substantially during the analyzed period • Repeat purchasing represented a relatively small share of customers • Revenue was not heavily concentrated among the top sellers • Longer delivery times were associated with substantially lower customer review scores
Tools: PostgreSQL • SQL • pgAdmin • Excel
Want to see the queries?
View the complete SQL analysis on GitHub → https://github.com/jamietran8818/business-data-analytics-portfolio/blob/main/olist-sql-business-analysis/README.md


The network for creativity
Join 1.25M professional creatives like you
Connect with clients, get discovered, and run your business 100% commission-free
Creatives on Contra have earned over $150M and we are just getting started
Related posts

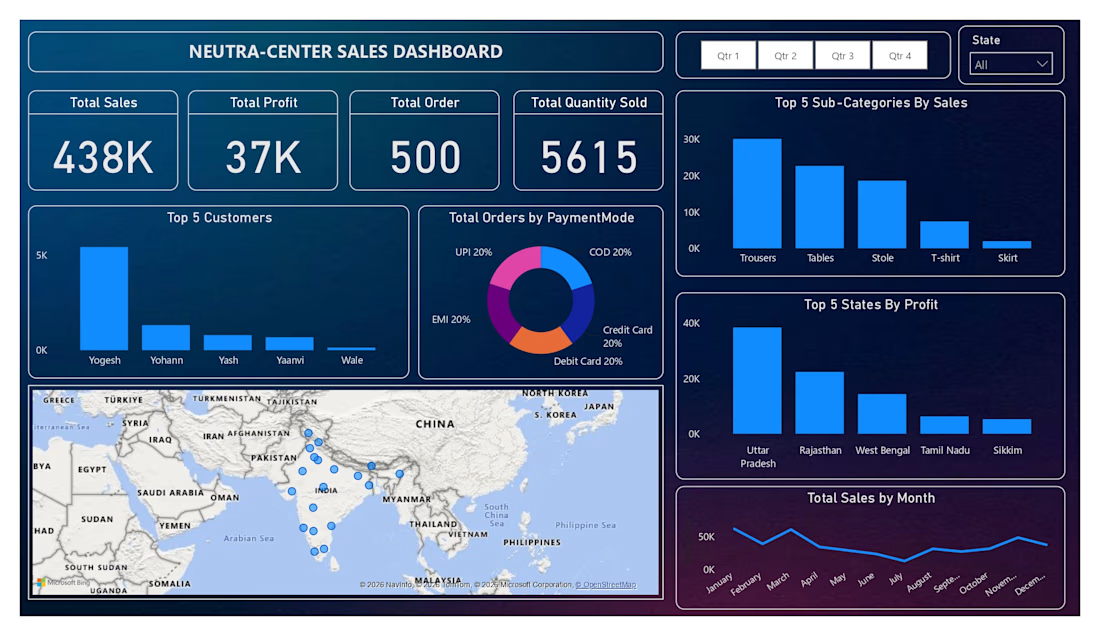
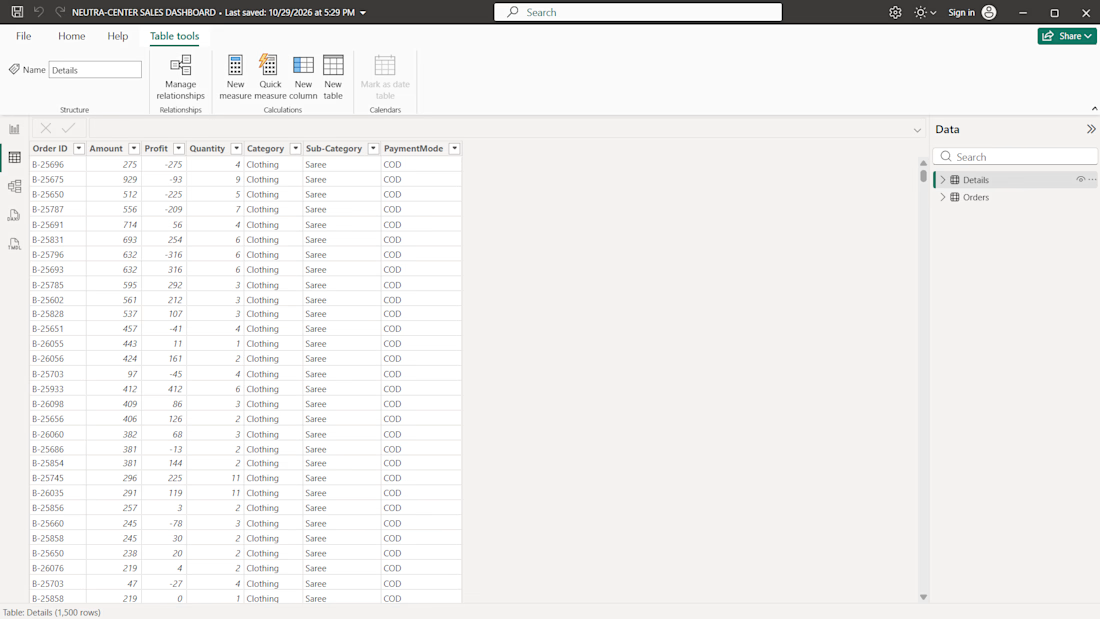
I created an interactive "Neutra-Center Sales Dashboard using Microsoft Power BI" to transform sales excel data into clear, meaningful business insights.
Key Features:
- Interactive quarterly and state filters
- Sales and profit KPI cards
- Customer and product performance analysis
- Payments method distribution
- State-wise profit coparison
- Monthly sales trend visualization
- Geographic sales distribution map
- Clean, modern dashboard design
This project demonstrates my ability to present sales data in an organized, interactive, and visually appealing format to help user understand business performance and identify important trends.


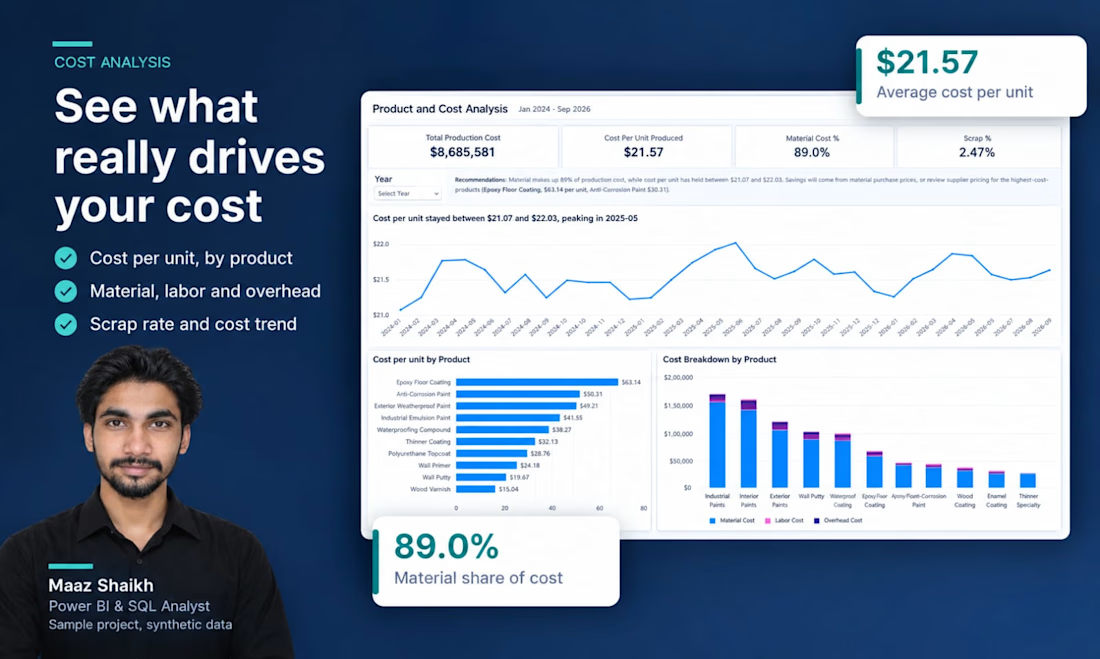
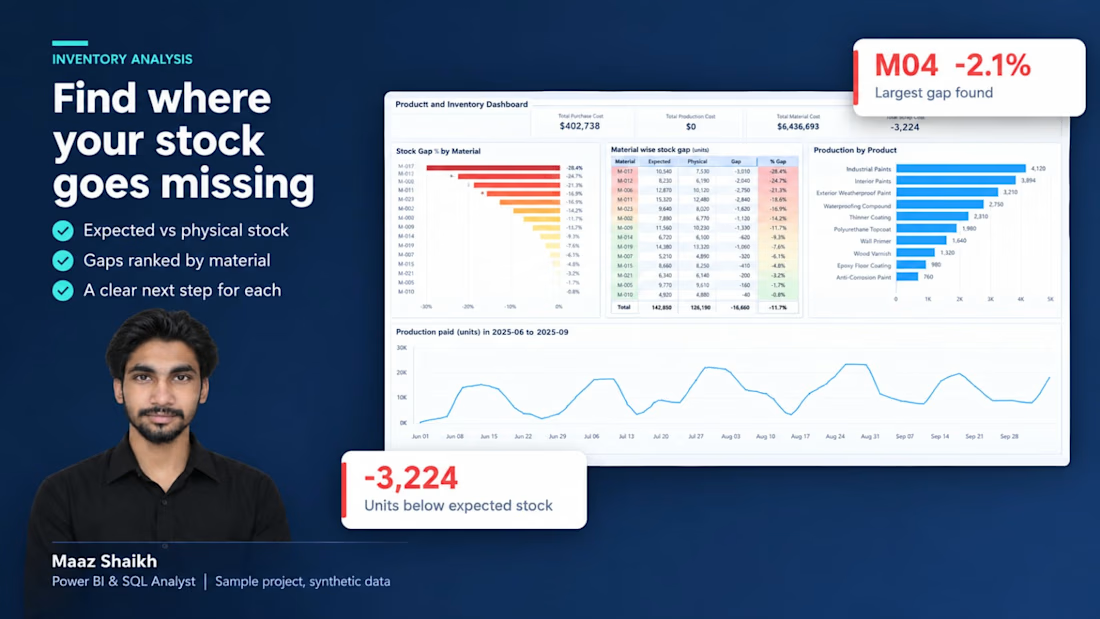
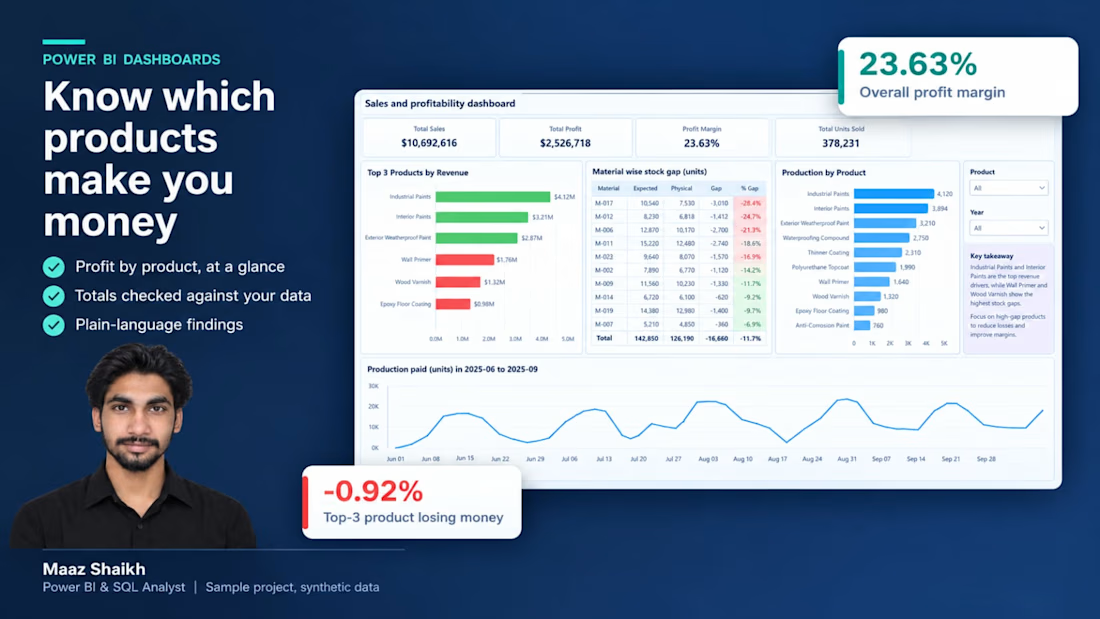
Built an end-to-end Manufacturing Analytics project using SQL and Power BI.
The project focuses on analyzing sales performance, inventory levels, product costs, and estimated profitability.
Key business insights:
• Sales performance and monthly trends
• Inventory tracking and stock analysis
• Product-level cost and margin analysis
• Bulk vs Regular order comparison
Tools: SQL Server, Power BI, DAX.
This is an independent portfolio project demonstrating practical business analytics skills.
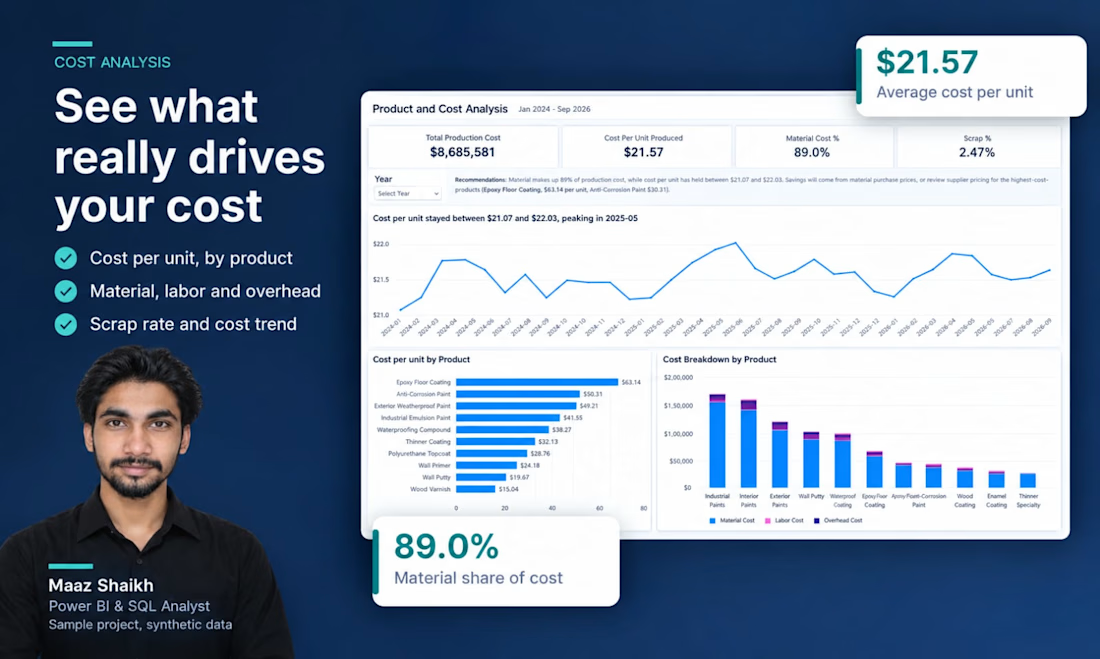
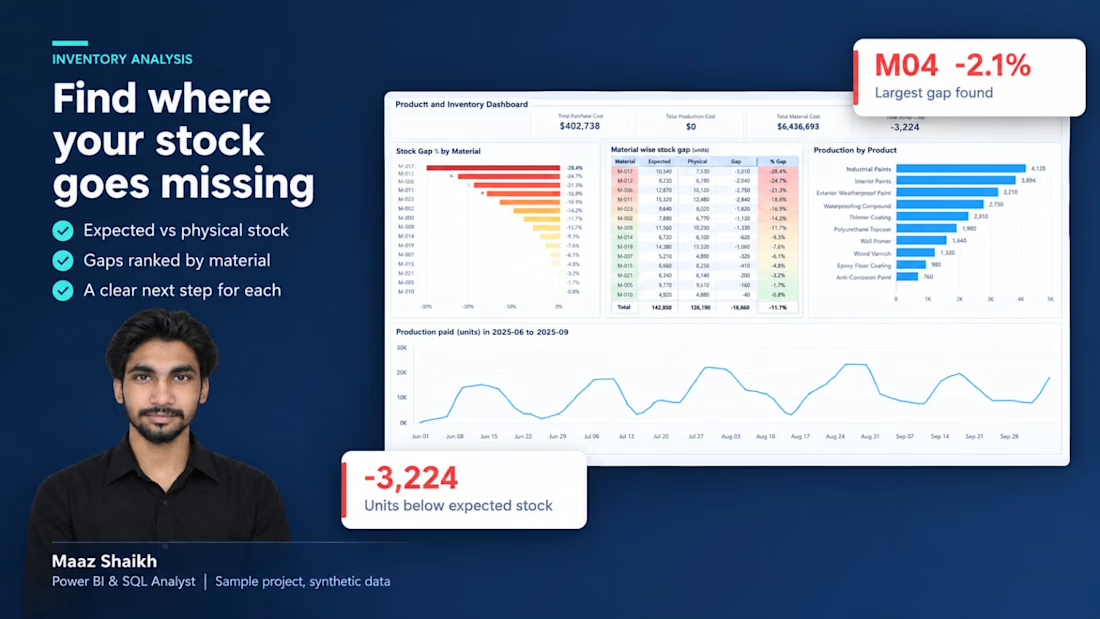
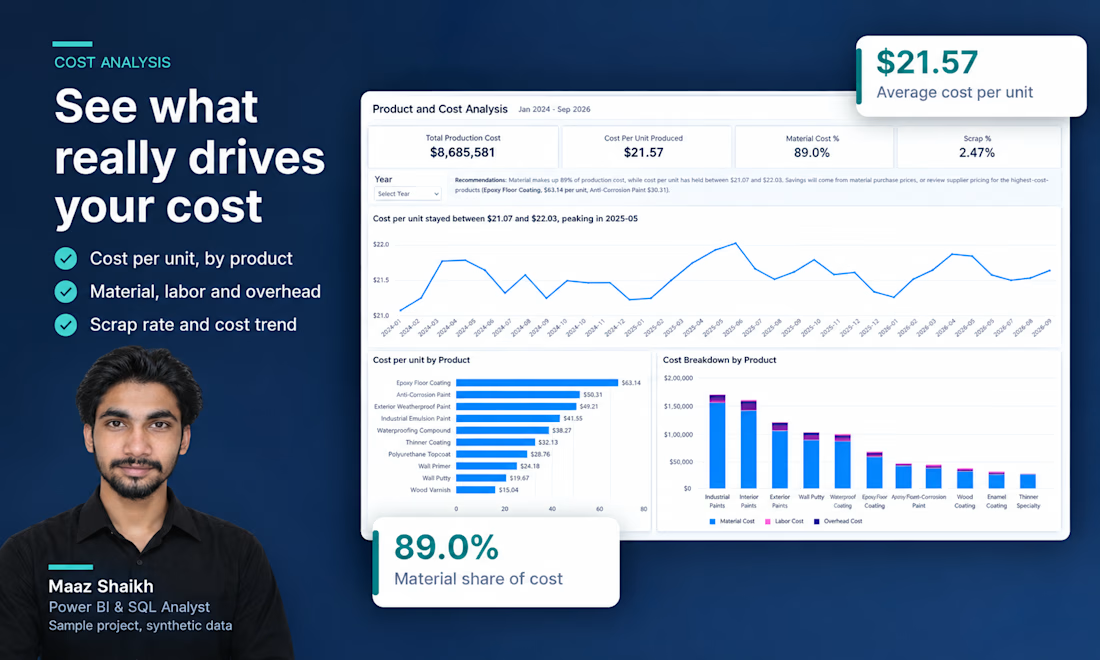
Built an end-to-end Manufacturing Analytics project using SQL and Power BI.
The project focuses on analyzing sales performance, inventory levels, product costs, and estimated profitability.
Key business insights:
• Sales performance and monthly trends
• Inventory tracking and stock analysis
• Product-level cost and margin analysis
• Bulk vs Regular order comparison
Tools: SQL Server, Power BI, DAX.
This is an independent portfolio project demonstrating practical business analytics skills.