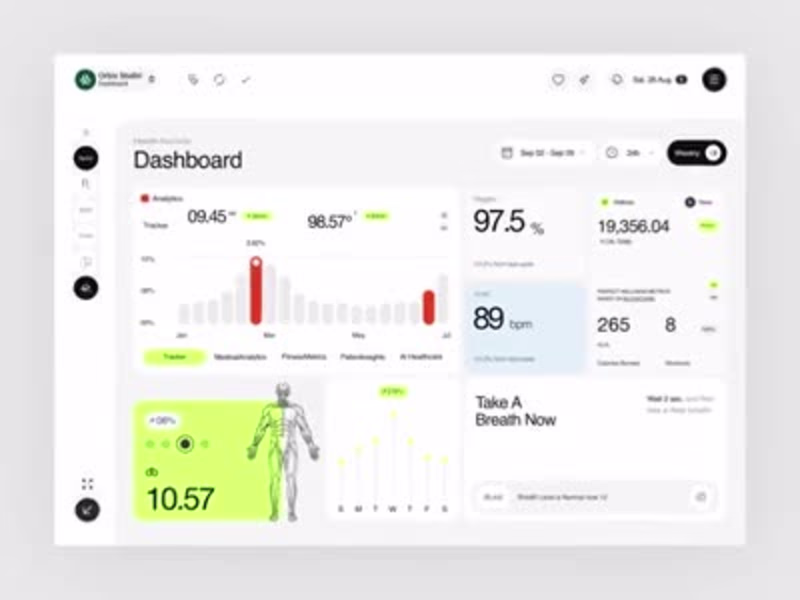
Data Visualization Projects in BangladeshData Visualization Projects in BangladeshMost health dashboards show you numbers. This one tells you what to do with them right down to "Take A Breath Now."
A modern health records dashboard designed to make medical analytics, fitness metrics, and wellness insights feel clear and genuinely personal. Built for clinicians, coaches, and individuals managing their complete health picture in one workspace.
Designed in Figma with a clean white and neon green interface that keeps complex health data easy to act on. Tracker analytics, oxygen levels, heart rate, calories, workouts, breath coaching, and blockchain-verified wellness metrics all in one calm, readable layout.
The same structure adapts easily for medical SaaS, personal wellness apps, fitness tracking, or AI healthcare products. Every section designed to balance clinical precision with human warmth.
Really happy with how the crisp white canvas, neon green accents, and human anatomy visuals turned complex medical data into something that actually feels good to open every morning.
Would love to hear your thoughts on the UI direction. 👀
UX Design | Health Tech | Dashboard UI | SaaS Platform
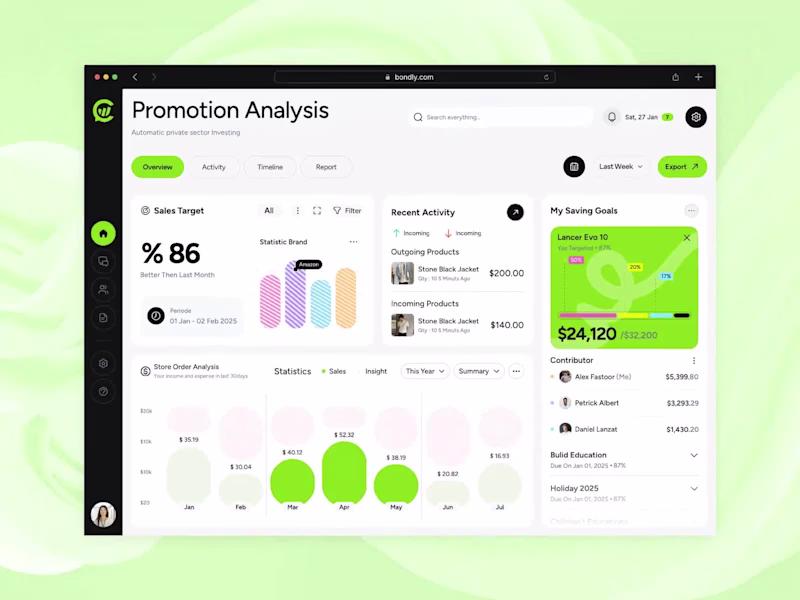
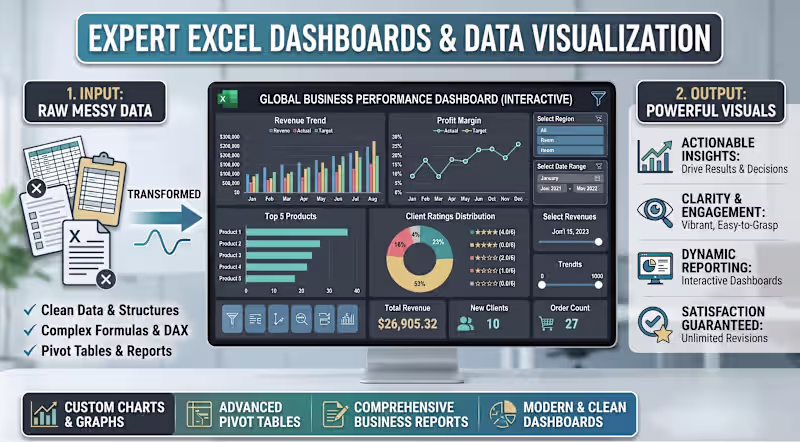
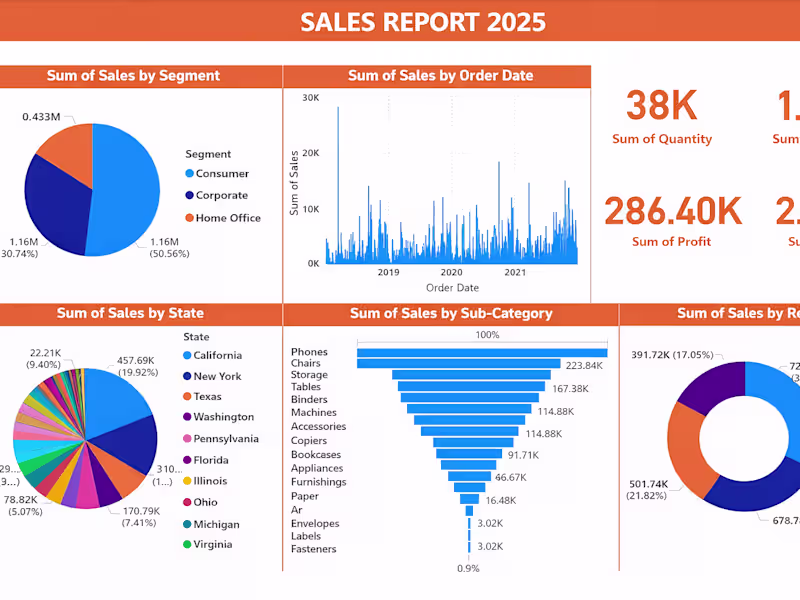
Tools: Figma, Jitter How to Turn Raw, Messy Data Into Powerful Business Insights 📊
If you are spending hours wrestling with complex spreadsheets, it’s time for a system upgrade. How do you bridge the gap between heavy data entry and strategic decision-making? By moving from static files to interactive, automated reporting.
At DataTale Studio, I specialize in transforming fragmented data into dynamic Excel dashboards that drive real business results.
The Transformation Process:
The Input: I take your raw data and build a robust backend using clean structures, complex formulas, and advanced DAX.
The Output: You receive a modern, clean dashboard featuring custom charts, advanced pivot tables, and vibrant data visualization.
Why collaborate with DataTale Studio?
Actionable Insights: Replace confusing rows of numbers with clear, visual metrics.
Dynamic Reporting: Interact directly with your data to spot trends instantly.
Satisfaction Guaranteed: I offer unlimited revisions to ensure your custom dashboard perfectly fits your workflow.
Stop guessing and start analyzing. If you are ready to streamline your business reporting, let's get to work. Send an inquiry today to discuss your custom data visualization project! ⚙️