Data Science Projects in Bangladesh
Data Science Projects in Bangladesh
Sign Up
Post a job
Sign Up
Log In
Filters
2
Projects
People
Message
6
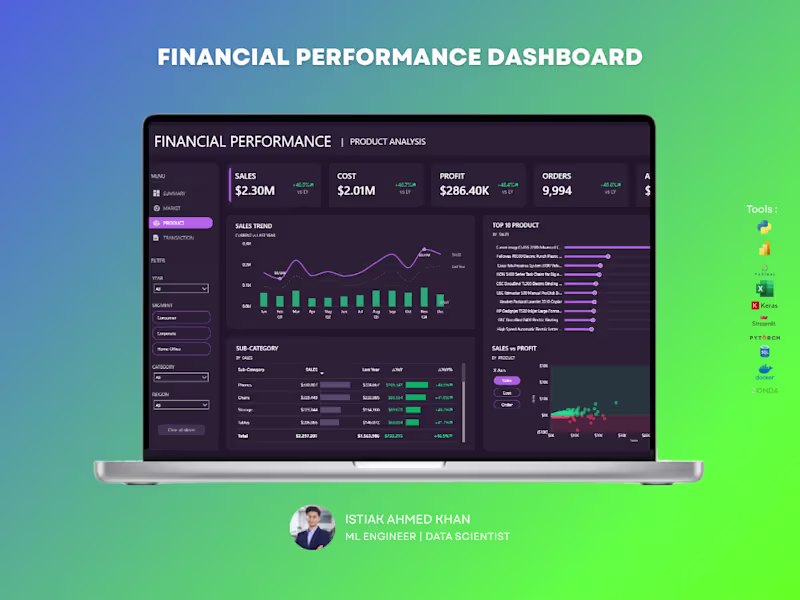
Istiak Ahmed Khan
The Financial Performance Dashboard provides a comprehensive overview of an organization’s financial health by tracking revenue, expenses, profitability, and key financial indicators. Built using Power BI, this dashboard enables finance teams and decision-makers to monitor performance, identify trends, and make data-driven strategic decisions.
6
974
Message
1
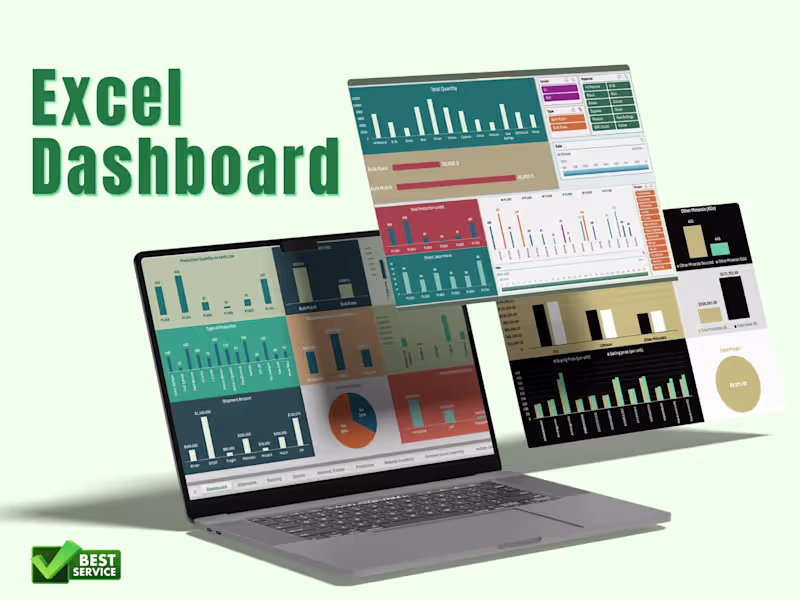
Syeed Ponir
Excel charts and Dashboards
1
2
Message
0
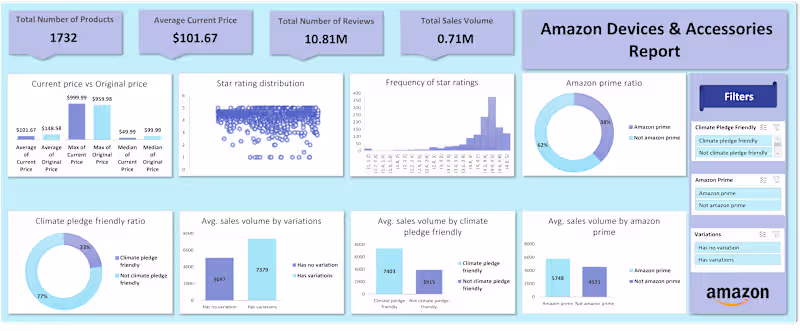
Nazmul Islam Rakin
Amazon Accessories Data Analysis
0
20
Message
0
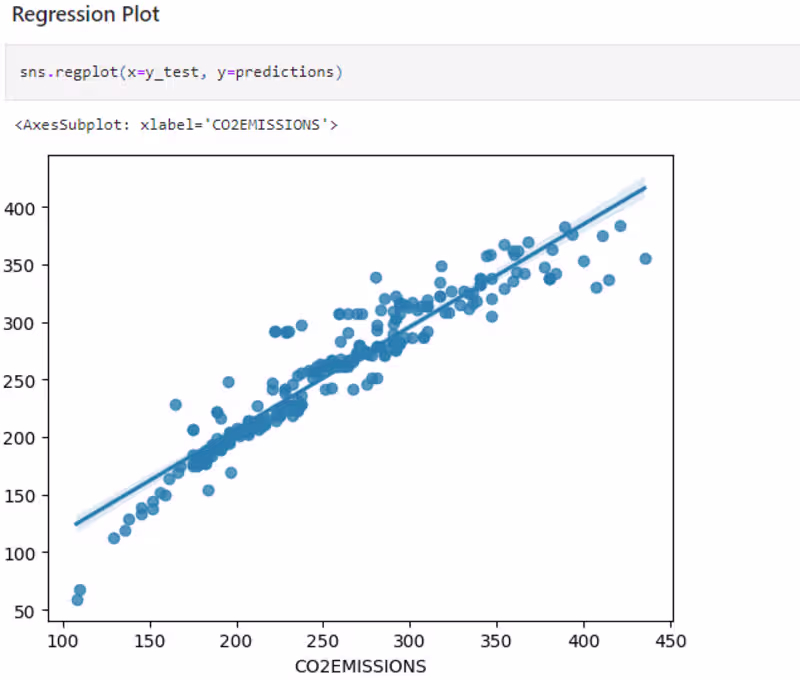
Sadidul Kabir
Predicting CO2 emissions using ML Regression Models
0
4
Message
0
Abir Hassan
AI-Powered Chatbot Development
0
1
Message
0
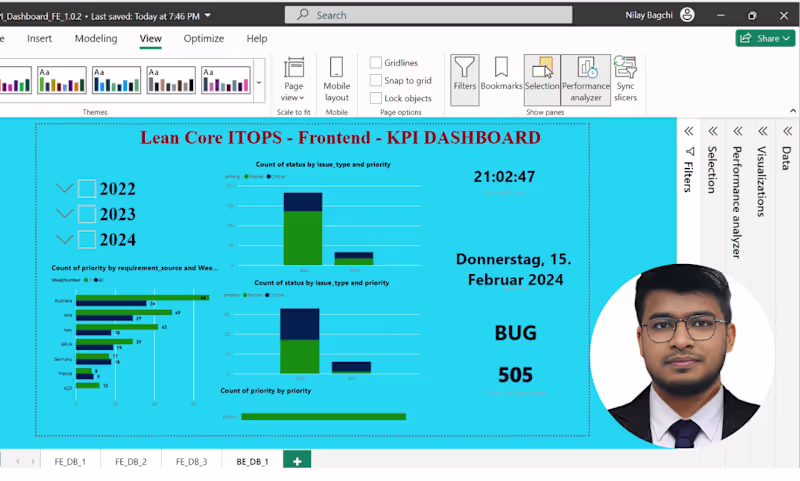
Md Sadiul Haque
Power BI Project Some Work
0
11
Message
13
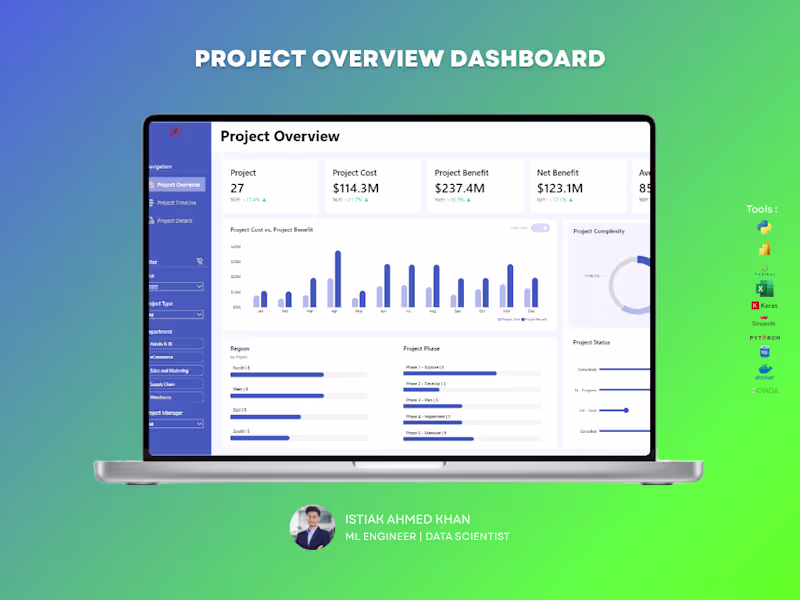
Istiak Ahmed Khan
This Project Overview Dashboard provides a comprehensive view of project performance, financial outcomes, and operational progress across the organization. Built using Power BI, this dashboard enables project managers and executives to monitor key project metrics, evaluate cost efficiency, and track overall project status in real time. Key KPIs Tracked: ✔ Total Projects – Number of active and completed projects ✔ Project Cost – Total investment allocated across projects ✔ Project Benefit – Estimated value or return generated from projects ✔ Net Benefit – Difference between project benefit and cost ✔ Average Completion Rate – Overall project progress percentage
5
13
1.3K
Message
0
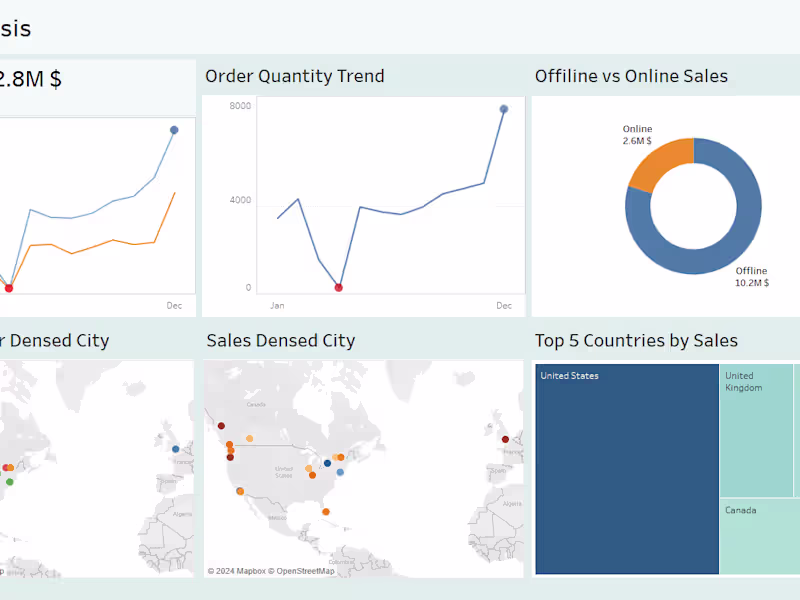
Nazmul Islam Rakin
Global Electronics Retailers analysis
0
18
Message
0
Md Sadiul Haque
Data analysis KPI Dashboard
0
11
Message
5
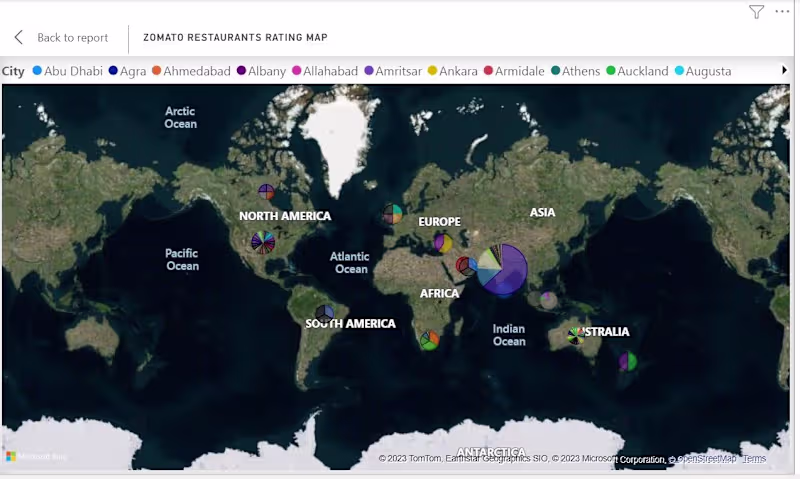
Istiak Ahmed Khan
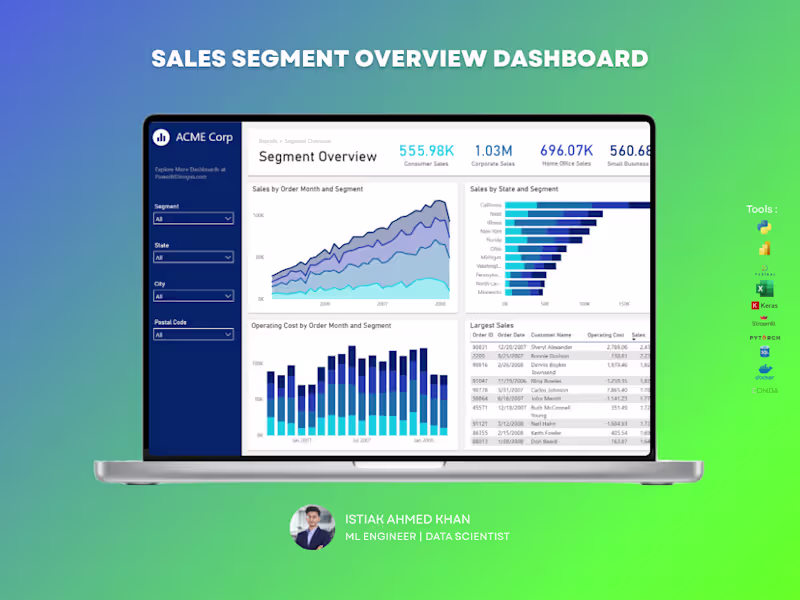
The Sales Segment Analysis Dashboard provides a detailed overview of sales performance across different customer segments, geographic regions, and time periods. Built using Power BI, this dashboard enables business leaders and sales teams to monitor revenue distribution, analyze customer segments, and identify high-performing markets. Key KPIs Tracked: ✔ Consumer Sales – Total revenue generated from individual customers ✔ Corporate Sales – Revenue from enterprise and corporate clients ✔ Home Office Sales – Sales generated from home office customers ✔ Small Business Sales – Performance of small business customer segment
2
5
835
Message
0
Nazmul Islam Rakin
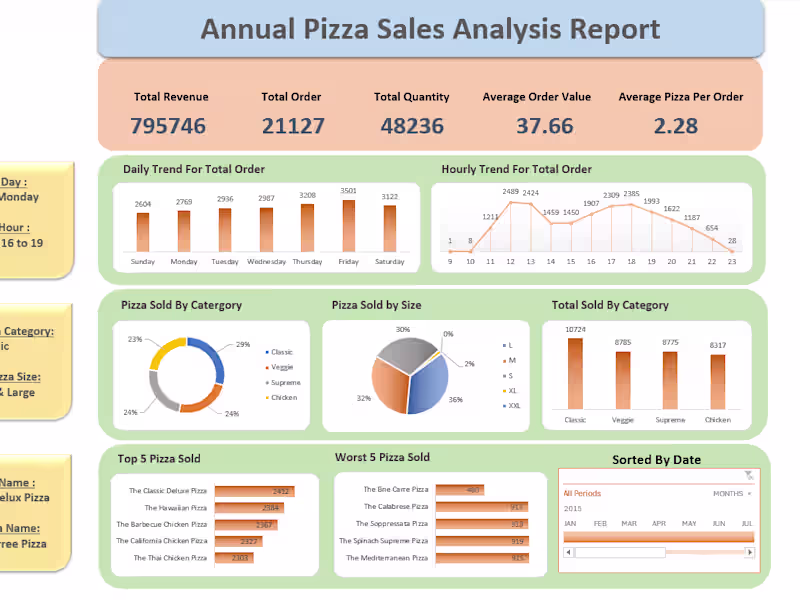
Pizza sales analysis
0
18
Message
5
Istiak Ahmed Khan
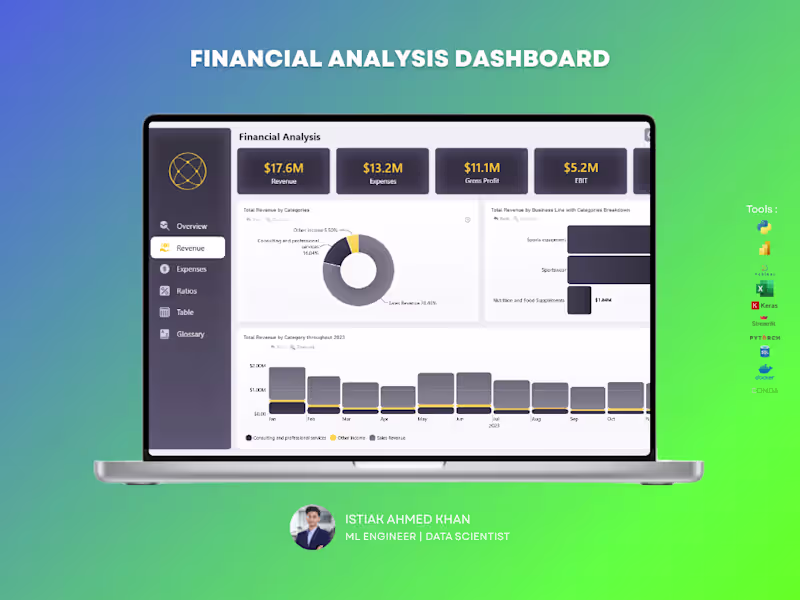
The Financial Performance Analysis Dashboard provides a comprehensive overview of an organization’s financial health by analyzing revenue, expenses, profitability, and key financial ratios. Developed using Power BI, this dashboard enables finance teams and decision-makers to monitor business performance, track profitability trends, and evaluate financial efficiency in real time. Key KPIs Tracked ✔ Revenue – Total income generated from business operations ✔ Expenses – Combined operational and non-operational costs ✔ Gross Profit – Revenue remaining after cost of goods sold (COGS) ✔ EBIT – Earnings before interest and taxes, indicating operational profitability ✔ Net Profit – Final profit after all expenses, interest, and taxes
4
5
930
Message
7
Istiak Ahmed Khan
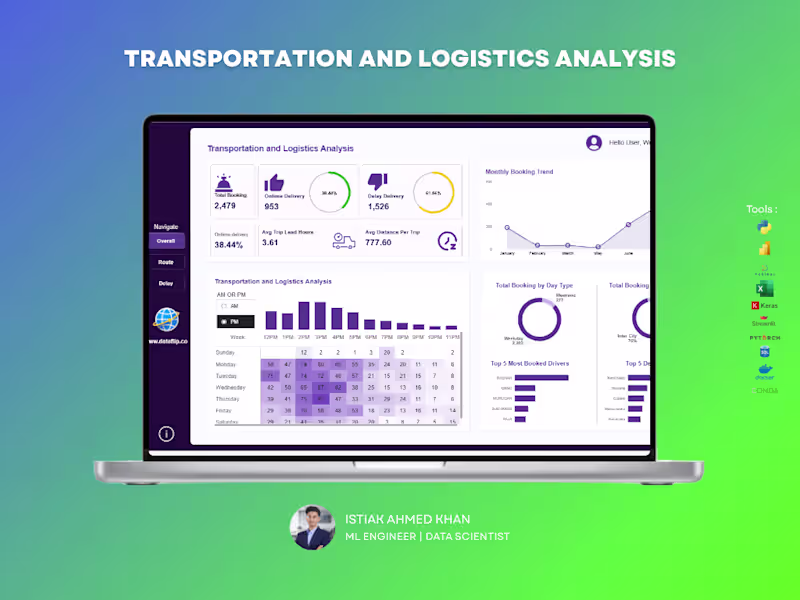
Managing logistics operations without clear insights can lead to delays, inefficiencies, and lost revenue. This dashboard is built to give you complete visibility into your transportation performance — all in one place. A powerful analytics solution that helps you track bookings, delivery performance, delays, and operational efficiency in real time. Designed for clarity and speed, so you can make decisions without digging through raw data. 🔹Monitor on-time vs delayed deliveries instantly 🔹Track booking trends and operational workload over time 🔹Analyze trip efficiency with lead time and distance metrics 🔹Identify peak hours and demand patterns 🔹Evaluate top drivers and most frequent routes/destinations 🔹Compare weekday vs weekend performance If you want a clean, professional dashboard that turns your logistics data into real operational insights, I can build a custom solution tailored to your business needs.
2
7
252
Message
3
Istiak Ahmed Khan
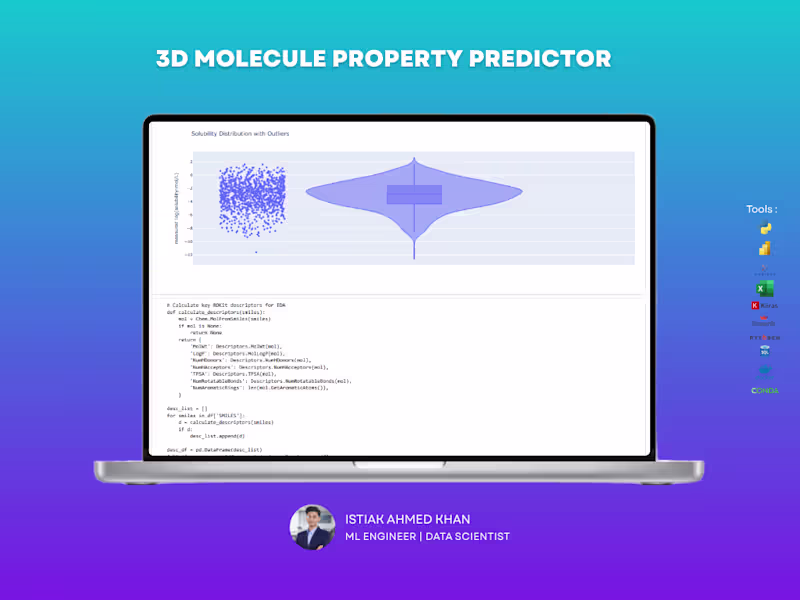
3D Molecular Intelligence: Accelerating Drug Discovery through Predictive Analytics The Impact: This project addresses a critical bottleneck in pharmaceutical research: determining molecular solubility (logS). By replacing slow, expensive lab tests with high-precision machine learning, this system enables scientists to screen thousands of compounds in seconds, significantly reducing the cost and time required to bring new life-saving drugs to market. Drastic Cost Reduction: The predictive pipeline reduces early-stage experimental screening costs by 70–90%, allowing research teams to focus resources on the most promising drug candidates. High-Precision Forecasting: Utilizing a hybrid 3D feature engineering approach, the system achieves a remarkable 91.3% accuracy (R² score) in predicting solubility, providing a highly reliable alternative to physical testing. Accelerated R&D Cycles: By automating the identification of viable molecules, the tool dramatically shortens the "hit-to-lead" time in pharma and materials science, getting products to market faster. Empowering Researchers: I deployed a professional Streamlit dashboard featuring an interactive 3D molecular viewer. This allows non-technical chemists to visualize complex structures and make data-driven decisions without needing to write a single line of code
3
292
Message
10
Istiak Ahmed Khan
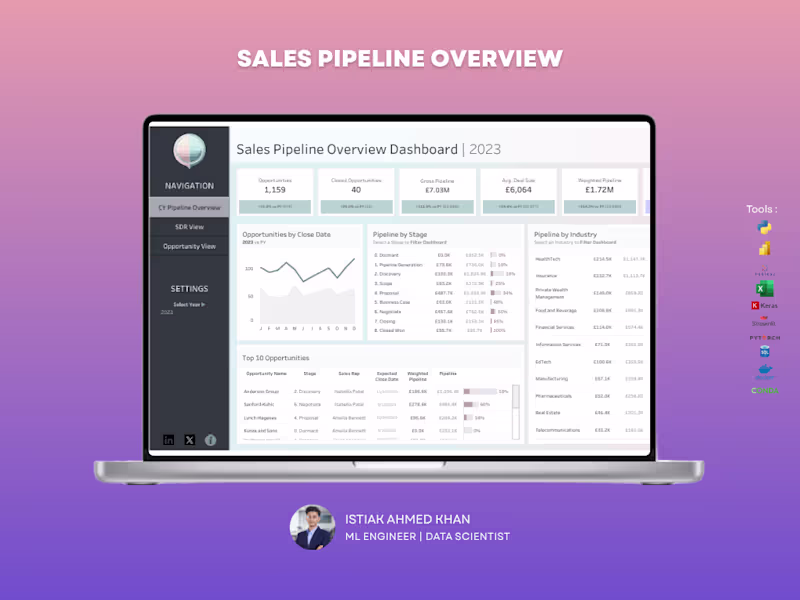
Sales Pipeline Dashboard – Tableau Struggling to track your sales pipeline and forecast revenue accurately? This dashboard gives you a clear, real-time view of your entire sales funnel, helping you stay on top of opportunities and close deals faster. What You Get A centralized Tableau dashboard that brings together pipeline value, deal stages, and performance metrics into one intuitive view. No more scattered reports — everything you need is in one place. Key Capabilities Track total opportunities and closed deals Monitor gross pipeline and weighted pipeline value Analyze pipeline by sales stage to identify bottlenecks Compare pipeline performance across industries View top opportunities and deal progress Understand average deal size and close trends Why It Matters Without visibility into your pipeline, it’s easy to miss opportunities and misjudge forecasts. This dashboard helps you identify stuck deals, improve conversion rates, and predict revenue more accurately. Perfect For Sales teams and managers B2B companies Startups scaling their sales process Agencies managing multiple clients Let’s Build Yours If you want a high-impact Tableau dashboard that turns your sales data into actionable insights, I can create a custom solution tailored to your business.
4
10
381
Message
3
Istiak Ahmed Khan
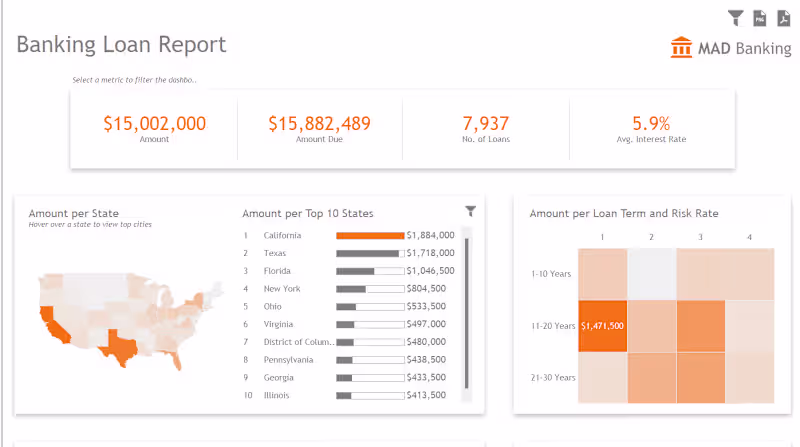
Tableau banking loan report
3
5
Explore projects