The network for creativity
Join 1.25M professional creatives like you
Connect with clients, get discovered, and run your business 100% commission-free
Creatives on Contra have earned over $150M and we are just getting started
Back to feedPost
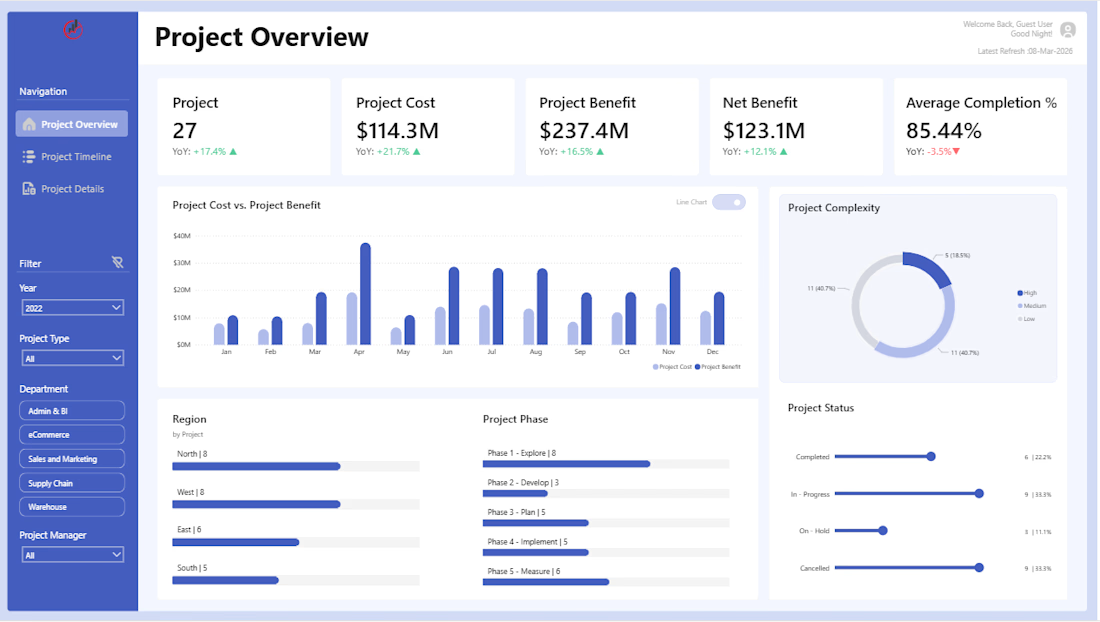
This Project Overview Dashboard provides a comprehensive view of project performance, financial outcomes, and operational progress across the organization. Built using Power BI, this dashboard enables project managers and executives to monitor key project metrics, evaluate cost efficiency, and track overall project status in real time.
Key KPIs Tracked:
✔ Total Projects – Number of active and completed projects
✔ Project Cost – Total investment allocated across projects
✔ Project Benefit – Estimated value or return generated from projects
✔ Net Benefit – Difference between project benefit and cost
✔ Average Completion Rate – Overall project progress percentage
Tracking Net Benefit alongside Project Cost in real time is really powerful for executive decision making — gives leadership the full financial picture without digging into raw data. Well structured dashboard!
Thank you! I really appreciate that insight 🙌
That was exactly the goal when designing the dashboard — to give leadership a quick but meaningful financial overview without needing to dive into raw project data. Real-time visibility into cost vs. benefit can make a big difference...
Absolutely — when leadership can see cost vs benefit at a glance, decisions happen faster and with more confidence. That's the real power of a well-designed dashboard. Great work!
Thank you for the support and encouragement😊
Nice!
The network for creativity
Join 1.25M professional creatives like you
Connect with clients, get discovered, and run your business 100% commission-free
Creatives on Contra have earned over $150M and we are just getting started
Related posts
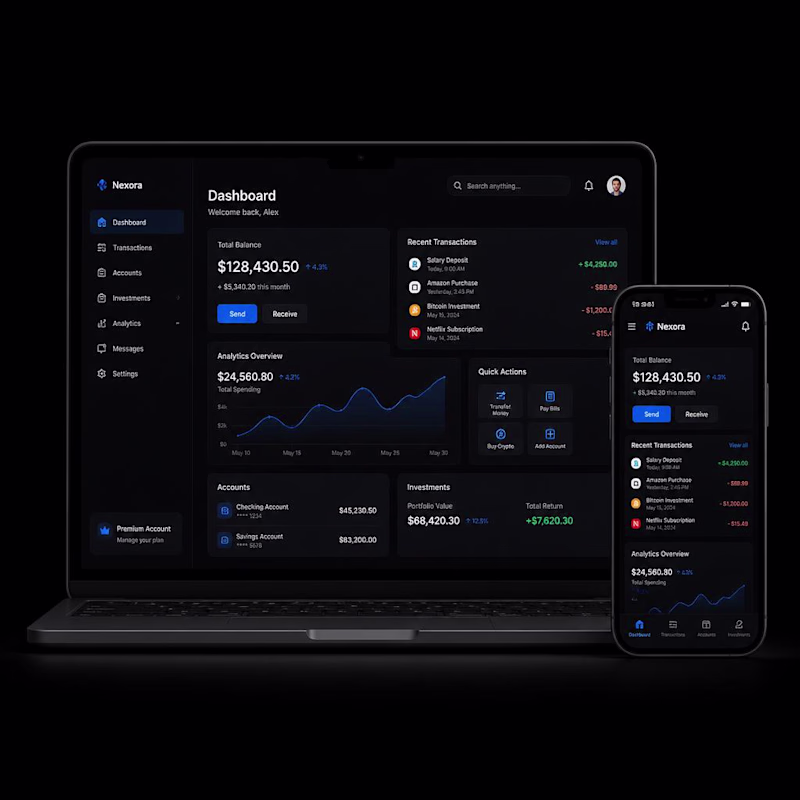
Quick design question for fellow designers and founders.
Which dashboard feels more premium to you?
☀️ A = Light Mode
🌙 B = Dark Mode
Let me know your choice.
5 voted
56%
4 voted
44%
9 votes
Closed
I choose dark mode
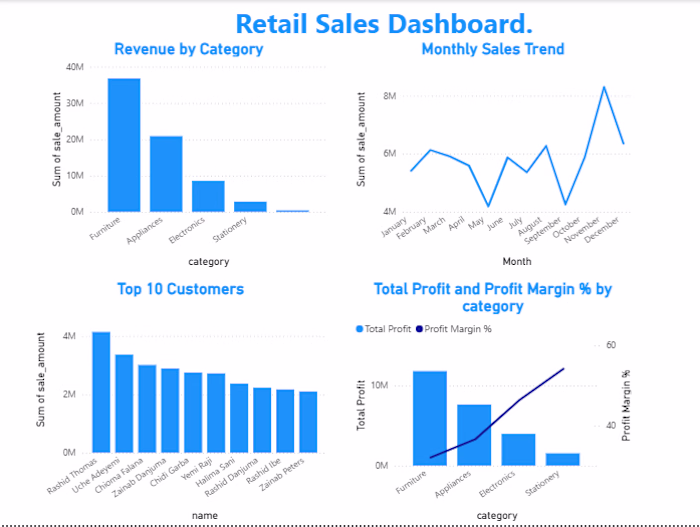
Retail Sales Analytics Dashboard (Power BI)
Interactive Power BI dashboard analysing two years of retail sales — revenue, profit, margins, top customers, and monthly trends. Built with data modelling and DAX measures.
Link: github.com/AYOOLUWA1996/retail-sales-analysis
Designed this Logistics Fleet Management SaaS Dashboard to give teams complete visibility over shipments, drivers, and deliveries in one powerful workspace.
Real-time tracking, route monitoring, shipment status updates, and performance insights are presented through a clean dark interface that keeps critical information easy to scan and act on. The neon green highlights create a strong visual focus, helping users track operations more quickly and make decisions with confidence.
Because when logistics move fast, clarity becomes your biggest advantage.
Challenges
View allTrending
Claude
Claude has entered the design space. How are you using Claude Design?
Contra University
Learn from expert creatives how to earn more using next-gen AI tools.
fifaworldcup2026
The World Cup is here and the whole world's watching. How are you designing for the world stage?
creativeaiflow
Creative AI workflows are evolving. What tools do you use, and what are their strengths and weaknesses?
freelancerlife
Freelancer life is wins, pivots, and everything in between. What’s yours right now?