Pizza sales analysis
Nazmul Islam Rakin
Demo:
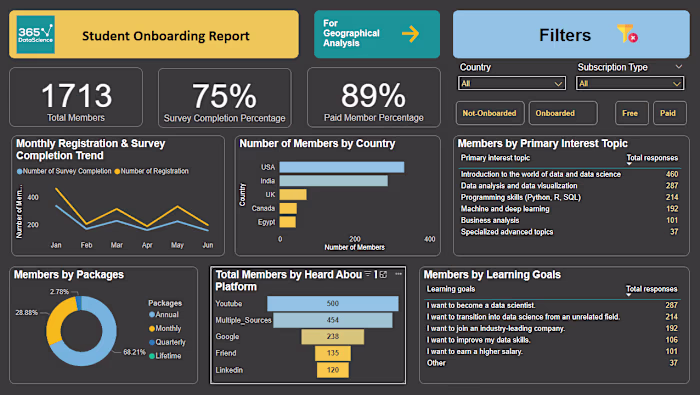
This project showcases an analysis of a pizza sales dataset using Excel and SQL, leveraging tools such as Power Query, PivotTables, and Excel’s data visualization features. The analysis focuses on key performance indicators (KPIs), trends, and sales insights across various dimensions, culminating in an interactive and dynamic dashboard.
Key Objectives:
Calculate important KPIs, including:
Total Revenue
Total Orders
Total Quantity Sold
Average Order Value
Average Pizza Quantity per Order
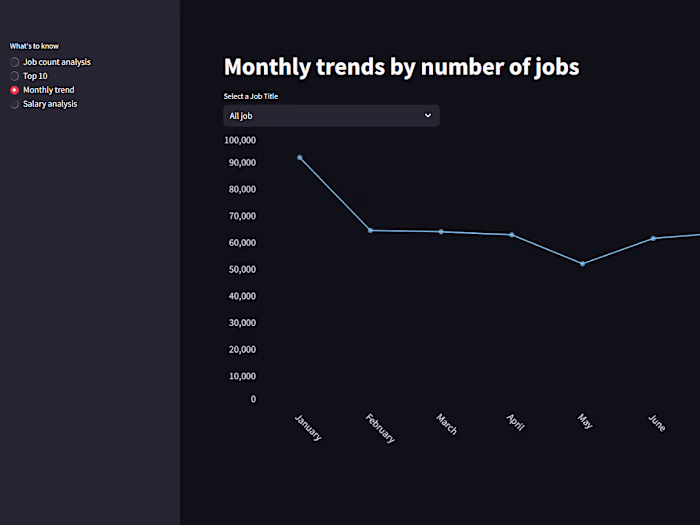
Analyze daily and hourly sales trends to identify peak business hours and high-revenue days.
Perform a sales analysis by pizza category and size to understand customer preferences.
Identify the Top 5 and Worst 5 pizzas by sales performance.
Build an interactive and dynamic dashboard for real-time insights and business monitoring.
Tools & Techniques Used
Excel: Power Query for data cleaning and transformation, PivotTables for analysis, and data visualization features for creating an interactive dashboard.
Power Query: To clean and standardize data formats, especially inconsistent date formats.
PivotTables: For quick aggregation and slicing of sales data to generate KPIs and sales insights.
Excel Charts: Used to create visualizations for trends, categories, and pizza performance.
SQL: Used to cross-validate the analysis
Like this project
Posted Oct 12, 2024
In this project, I analyze pizza sales data using SQL & Excel (Power Query, PivotTables) and build an interactive dashboard to highlight KPIs, trends & insights
Likes
0
Views
20