Data analysis KPI Dashboard
Md Sadiul Haque
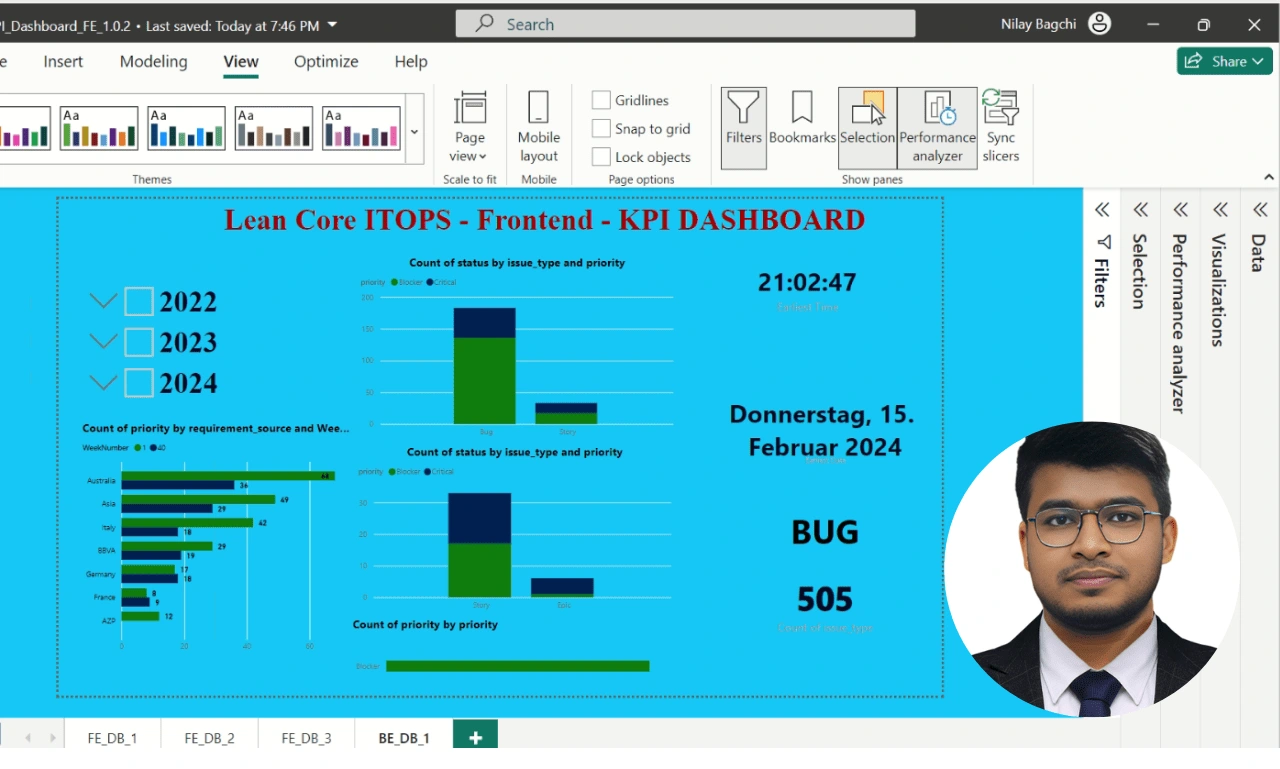
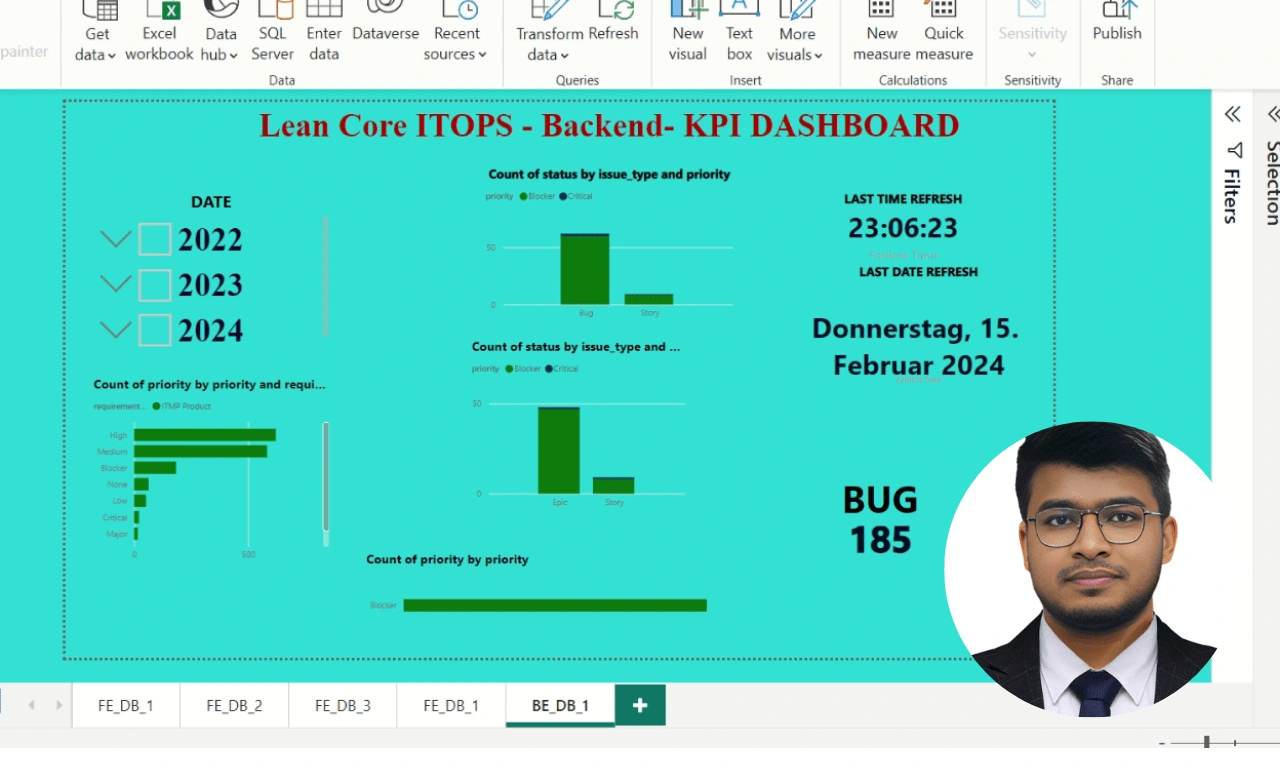
Here are some of the key insights from the dashboard POWER BI:
* The number of blockers and critical issues has decreased significantly from 2022 to 2024.
* The number of bugs has also decreased from 2022 to 2024.
* The number of stories has increased from 2022 to 2024.
* The most common issue type is bugs, followed by stories and epics.
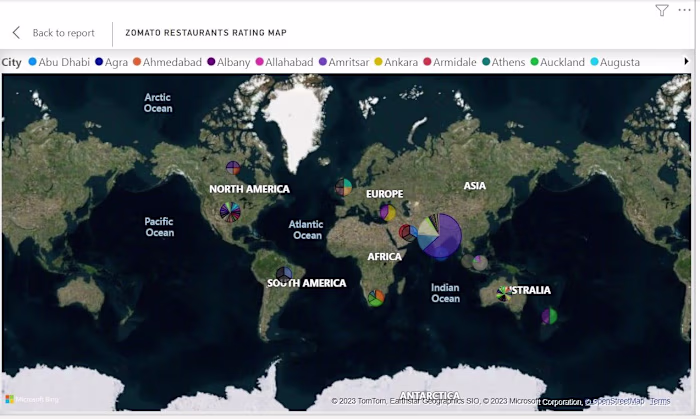
* The most common requirement source is Asia, followed by Italy and Australia.
Overall, the dashboard suggests that the team is making progress in resolving high-priority issues and reducing the number of bugs. However, there is still room for improvement in terms of the number of stories and epics.
It is important to note that this is just a brief overview of the dashboard and there may be other insights that can be gleaned from the data.
Do you have any other questions about the KPI dashboard?
If you have any questions just message me.
Like this project
Posted Jul 4, 2024
Data analysis KPI Dashboard