The network for creativity
Join 1.25M professional creatives like you
Connect with clients, get discovered, and run your business 100% commission-free
Creatives on Contra have earned over $150M and we are just getting started
Back to feedPost
The Financial Performance Analysis Dashboard provides a comprehensive overview of an organization’s financial health by analyzing revenue, expenses, profitability, and key financial ratios. Developed using Power BI, this dashboard enables finance teams and decision-makers to monitor business performance, track profitability trends, and evaluate financial efficiency in real time.
Key KPIs Tracked
✔ Revenue – Total income generated from business operations
✔ Expenses – Combined operational and non-operational costs
✔ Gross Profit – Revenue remaining after cost of goods sold (COGS)
✔ EBIT – Earnings before interest and taxes, indicating operational profitability
✔ Net Profit – Final profit after all expenses, interest, and taxes
dashboarddashboarddesignpowerbidashboardData ScienceData VisualizationAI Engineer Microsoft ExcelMicrosoft Power BITableau
Thank you
Really Impressive!
Thank you for your feedback!
The network for creativity
Join 1.25M professional creatives like you
Connect with clients, get discovered, and run your business 100% commission-free
Creatives on Contra have earned over $150M and we are just getting started
Related posts
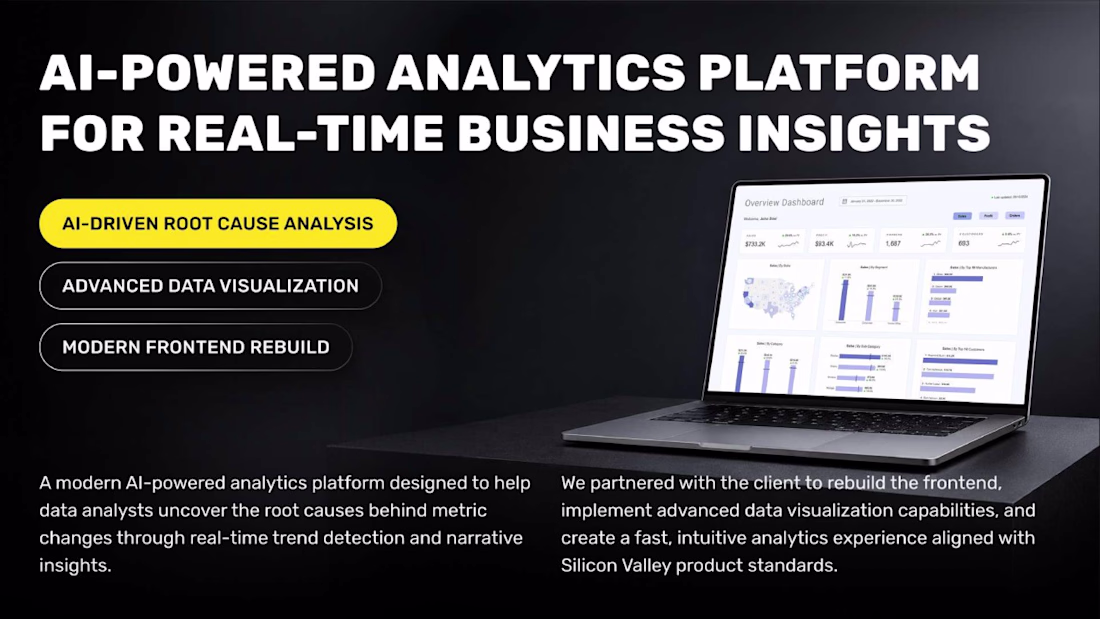
A founder from Silicon Valley came to us with a product that was already working.
The AI logic was solid. The backend did what it was supposed to. DataScoop could analyze metric changes, find the root causes and explain them in plain language - which, honestly, is genuinely hard to build.
The problem was everything the user actually saw.
The interface hadn't kept up with the product. There were Figma designs ready, a completely new visual direction, but no one had translated them into a working frontend yet. The existing code wasn't built to carry them. And the data visualization layer, the part that makes analytics actually readable, needed to be rebuilt from scratch.
So the ask was clear on the surface: rebuild the frontend, implement the new design, make it fast.
In practice, it was more nuanced than that.
Complex data files needed to be parsed and turned into charts that told a story, not just displayed numbers. Performance had to hold up so that insights landed in seconds, not after a loading spinner that made you forget what you were looking at. And all of it had to feel like it belonged together: the AI output, the visualizations, the interface, the Slack and email delivery.
We rebuilt the frontend in React.js and TypeScript, applied strict code quality standards from the start and worked through the Figma designs screen by screen, not just implementing them, but pressure-testing how they behaved with real data.
The hardest part wasn't any single technical problem. It was maintaining coherence, making sure that as the pieces came together, they felt like one product, not a patchwork.
The result is a platform where a data analyst can open it, see a metric move, and understand why, in plain language, in seconds, delivered wherever they actually work.
That's the version DataScoop's users have now.
Check it out
Great job
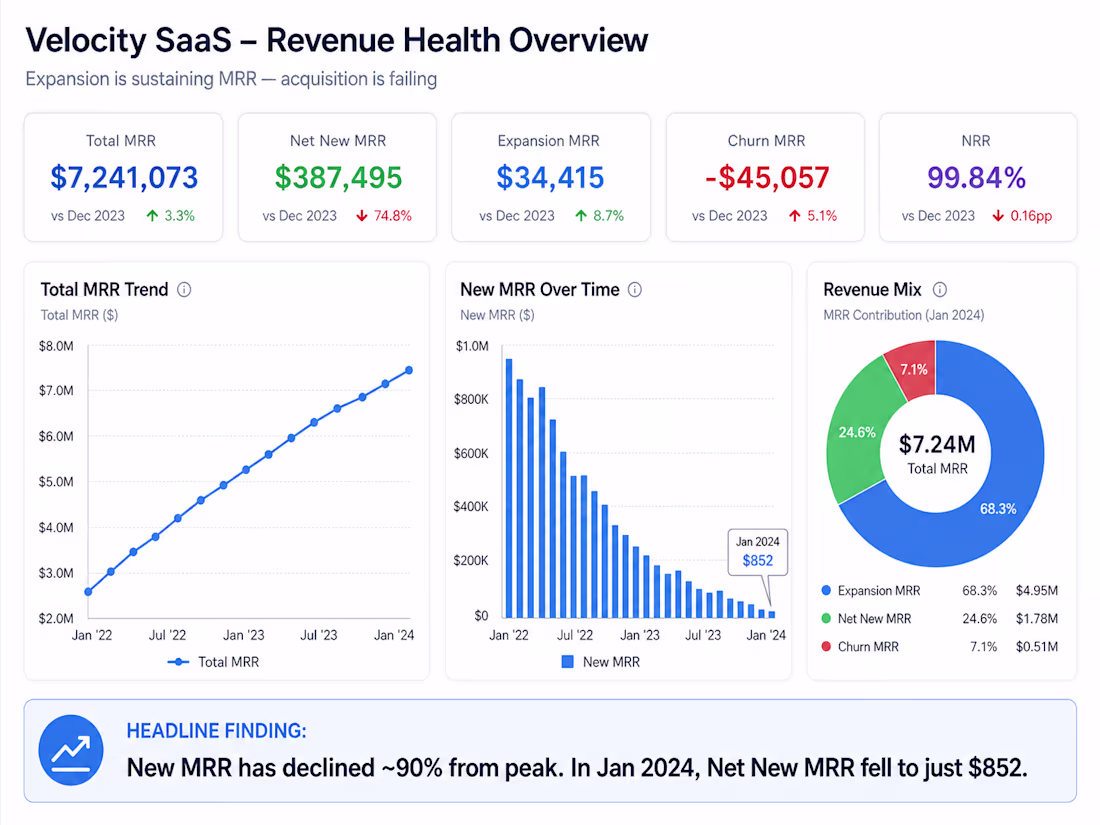
Project: Velocity SaaS – Revenue Turnaround Analysis
Type: Independent portfolio project
Dataset: Synthetic B2B SaaS, 2,000 accounts / 2.2M rows, benchmarked against ProfitWell/OpenView
What I did:
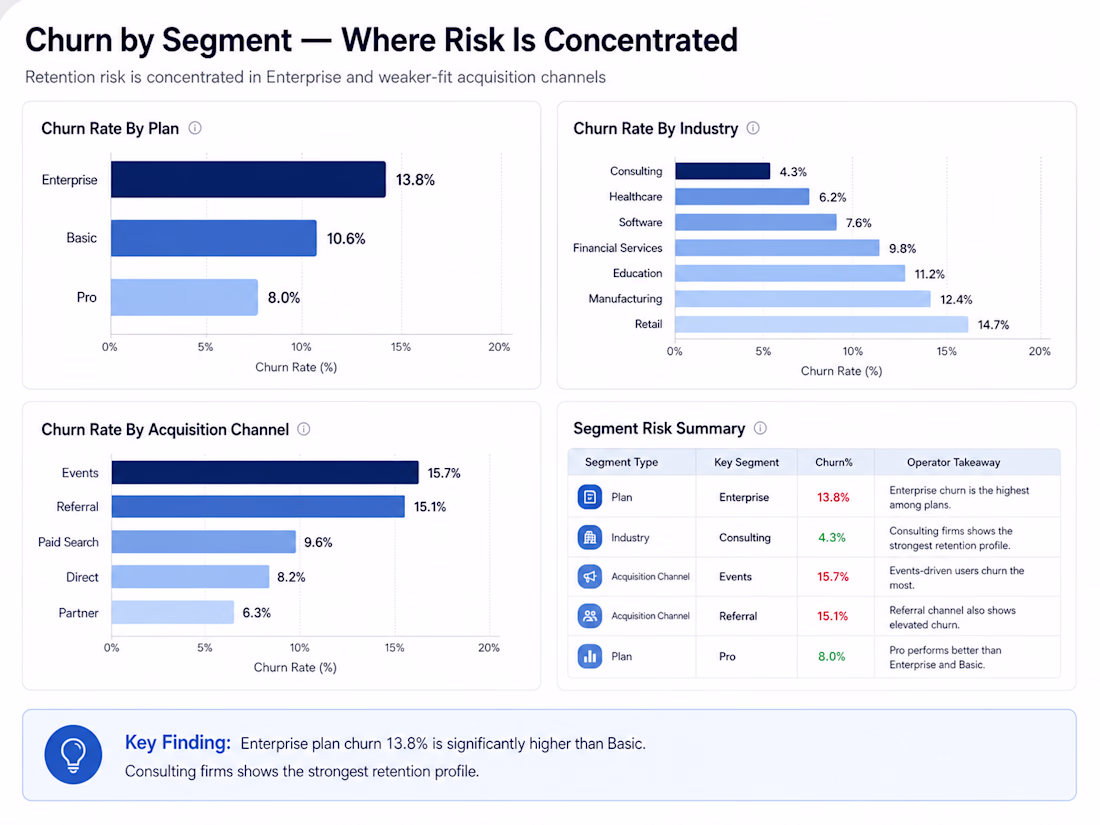
MRR waterfall analysis, churn segmentation by plan/industry/channel
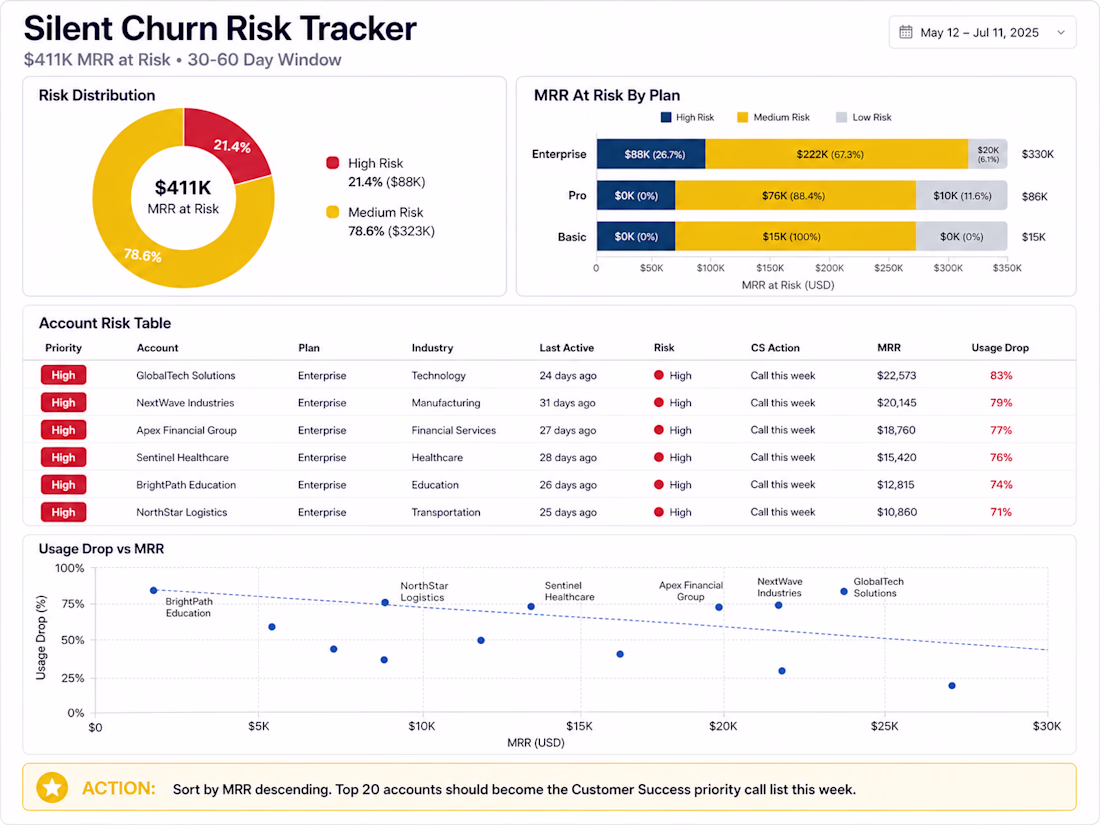
Usage decay / silent churn risk modeling
Logistic regression churn predictor: 98% recall, 70% precision, 0.82 F1
Built executive Looker Studio dashboard + Streamlit churn predictor
Outcome: $411K silent MRR at risk identified, CS-ready prioritized account list
Stack: SQL, DuckDB, Python, Pandas, Scikit-learn, Looker Studio, Streamlit
Live app: velocity-saas-churn-predictor.streamlit.app
Repo: github.com/SURAJRAJPUT2006
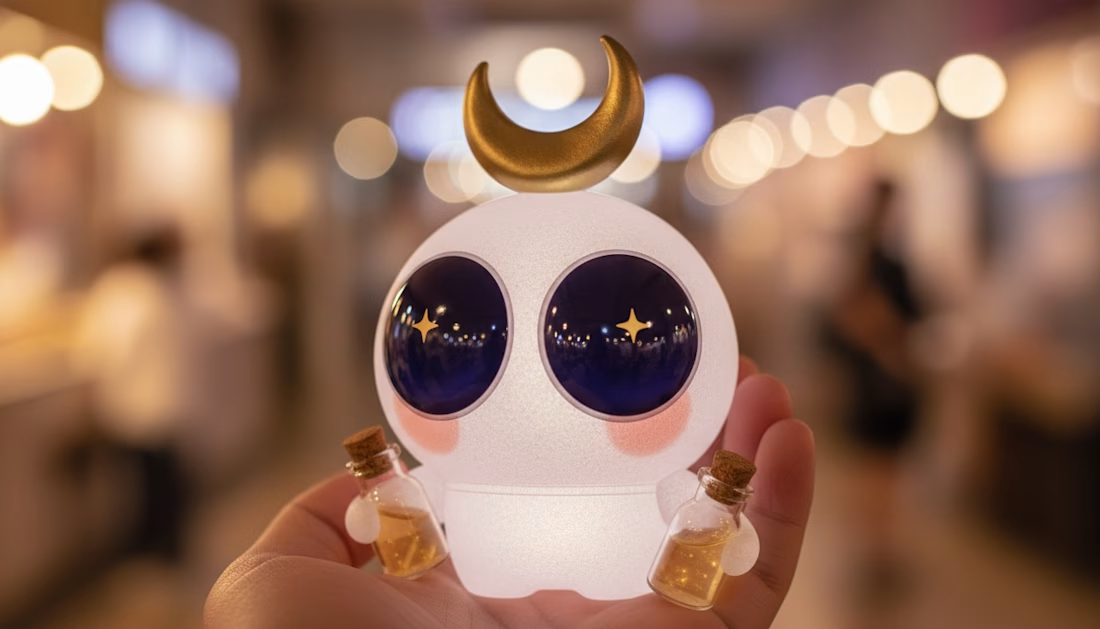
LUMIO — Night Market Series 🌙✨
Meet LUMIO — a tiny cloud spirit who fell asleep inside a lantern and woke up half-light, half-fog. Now he drifts through night markets after closing time, selling bottled moonlight and forgotten dreams to anyone still wandering.
The Character 👻
LUMIO was born from a single idea: what if the last light at a night market was alive?
Round, soft, and glowing from within — LUMIO's pearlescent body carries the warmth of every lantern that ever burned through midnight. His deep indigo eyes reflect entire galaxies. His golden crescent moon never leaves his head. And those two tiny potion bottles? One holds moonlight. The other holds something he won't talk about yet. @Contra HQ @Contra
He is palm-sized, precious, and completely unbothered by the dark.
The World 🏮
LUMIO lives in the quiet hour — that magical window between when the last stall closes and when the first light of morning arrives. Empty cobblestone streets. Warm bokeh of fading lanterns. The smell of something sweet that no one can place.
He doesn't just exist in this world. He is the mood of it.
What I Built 🎨
Every asset was built to prove LUMIO could travel anywhere and stay unmistakably himself:
🔮 Hero 3D Render — Full cinematic character, glowing subsurface body, gold crescent, twin moonlight bottles. The character that started everything.
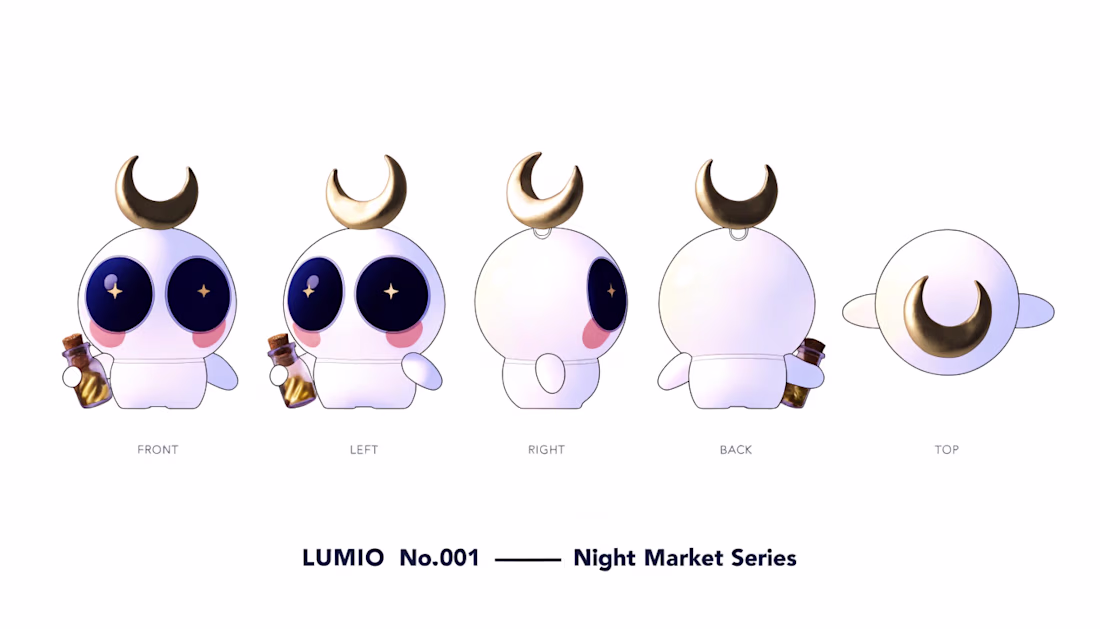
📐 Toy Turnaround Sheet — Front / Left / Right / Back / Top views. Designed like a real vinyl art toy product document. Every seam, every paint zone, every accessory detail locked down.
✋ Hand-Held Product Shot — LUMIO photographed as if he's a real physical collectible being held up at a night market. This was the image I needed to make people want to own him.
The Design System 🎨
A strict 4-color world. No exceptions:
#0D0D2B Midnight Navy — the sky he lives in
#F5F0FF Pearl White — his skin, his glow
#FFD97D Warm Gold — the moon, the magic
#C9B8FF Soft Lavender — his light on everything around him
Built With
🛠️ All visuals created entirely in Recraft Studio using V4 and V4.1 — character concepting in Exploration mode, toy turnaround with image-set consistency workflow, and the hand-held shot using photorealistic rendering.
"Every night market needs one light that never goes out." 🌙
@Recraft #Creative


Trending
Claude
Claude has entered the design space. How are you using Claude Design?
Contra University
Learn from expert creatives how to earn more using next-gen AI tools.
MagicPath
The canvas is infinite, and exploration is becoming the workflow. How are you using MagicPath?
creativeaiflow
Creative AI workflows are evolving. What tools do you use, and what are their strengths and weaknesses?
freelancerlife
Freelancer life is wins, pivots, and everything in between. What’s yours right now?