Results that are similar to your search
Similar results

Data Engineering and Automation




AI Agents | LLMs, Computer Vision & Full-Stack Dev

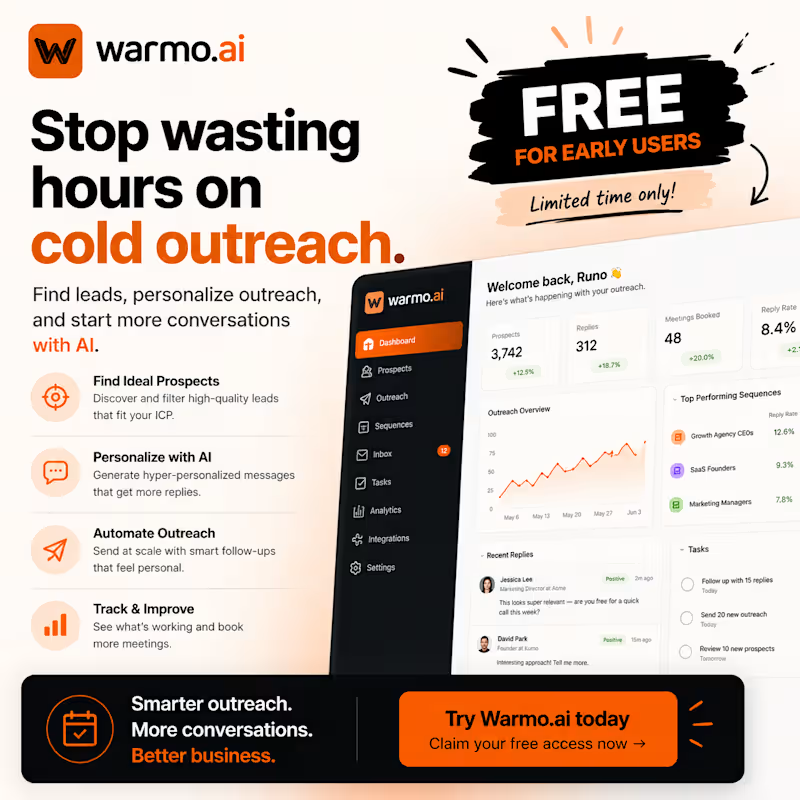
🚀 Most AI outreach tools stop at writing messages.
Warmo.ai (http://Warmo.ai) actually helps you find prospects, personalize outreach, and start meaningful conversations—all from one platform.
Whether you're a freelancer, agency owner, recruiter, or founder, it's built to save hours of manual work and help you book more meetings.
🔥 Best part? The first users can use it completely FREE.
If you've been waiting for an AI tool that actually helps you grow your business instead of just generating text, now's the time to try it.
👉 Check out Warmo.ai (http://Warmo.ai) and claim your free access while it's available.
#AI #Sales #LeadGeneration #Outreach #Freelancer #Agency #Startup #BusinessGrowth #Automation #Contra
7
245

Software Engineer


Data Engineer | Python, PostgreSQL, Docker & REST APIs
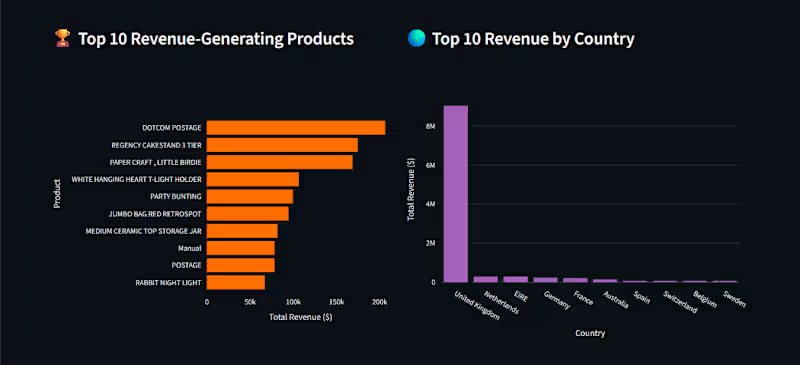
I just engineered and deployed a live Online Retail Executive Dashboard analyzing over $10.6M+ in transaction data.
Role: Data Analyst / BI Engineer
Tools Used: Python, Pandas, NumPy, MySQL, SQLAlchemy, PyMySQL, Streamlit, Plotly, Jupyter Notebook
Project Overview:
Engineered and deployed an interactive executive analytics application designed to process and visualize over $10.6M+ in raw online retail transaction data across 19k+ customer orders. The system automates key performance metric tracking, sales seasonality analysis, peak shopping hour detection, and customer lifetime value (LTV) segmentation.
PNG+ 1
Key Architecture & Execution Steps:
Database Architecture & Management: Structured relational database schemas and executed SQL queries via MySQL, SQLAlchemy, and PyMySQL to handle high-volume retail transactional records efficiently.
Data Pipeline & Transformation: Processed, cleaned, and aggregated raw order histories using Pandas and NumPy, handling missing values and calculating key financial KPIs.
Interactive BI Dashboard (Streamlit & Plotly): Built a responsive web dashboard featuring dynamic Plotly visualizations for monthly seasonality, hourly trend analyses, and top revenue-generating products.
Customer Segmentation & LTV Analysis: Isolated top VIP buyers driving significant revenue chunks to assist marketing and management in customer retention strategy.
Business Impact & Key Insights:
• Revenue Aggregation: Automated real-time tracking across $10.67M total revenue and 19k+ orders.
• Operational Efficiency: Identified peak shopping hours (12:00 PM – 2:00 PM) to inform targeted promotional schedules and server load planning.
• VIP Customer Targeting: Extracted lifetime value metrics to highlight high-value accounts responsible for major revenue share.
0
14
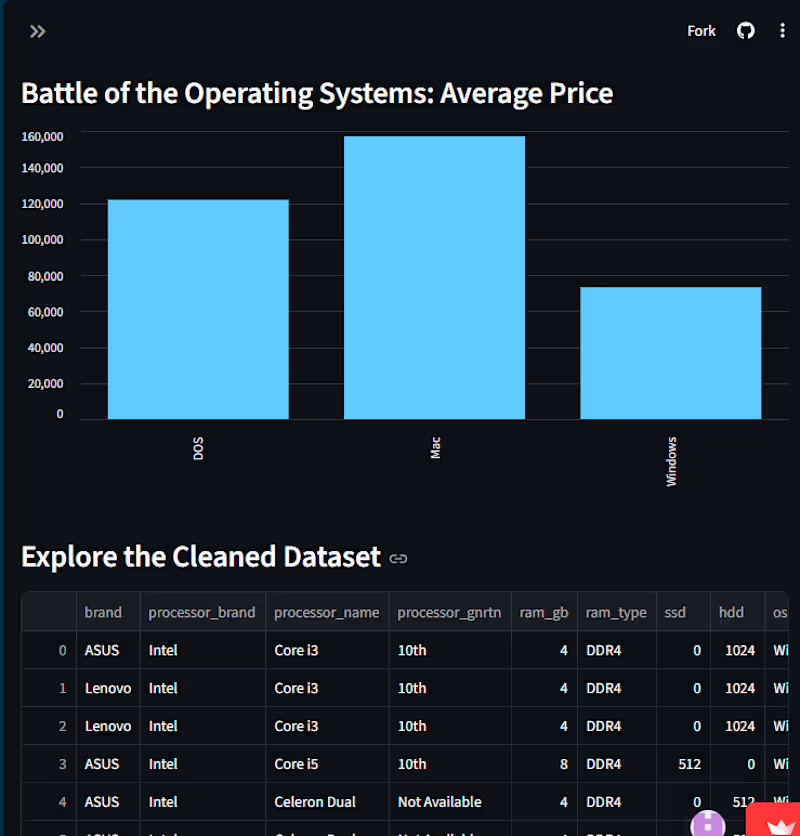
An automated data engineering pipeline and interactive Streamlit dashboard for analyzing laptop market prices and specifications.
Role: Data Analyst / Python Web Developer
Tools Used: Python, Streamlit, Pandas, Data Cleaning, Data Normalization
Project Overview
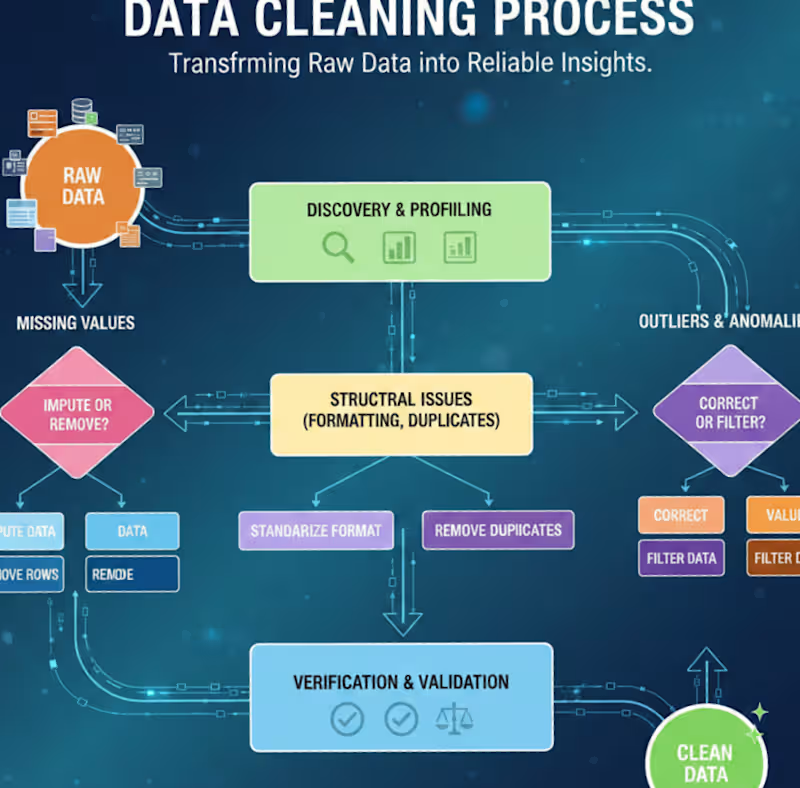
Transformed a chaotic, uncleaned dataset of laptop technical specifications and market prices into an optimized, interactive analytics tool with automated data quality workflows.
Key Architecture & Execution Steps
1. Data Ingestion & Cleaning: Built automated Pandas routines to parse dirty text, handle structural anomalies, normalize formatting, and resolve missing values.
2. Pipeline Automation: Packaged the cleaning architecture into modular, reusable Python functions.
3. Web Interface & Analytics: Developed a responsive Streamlit UI with dynamic sidebar filters, real-time KPI metrics, and OS price benchmarking charts.
4. Performance & Cloud Deployment: Implemented @st.cache_data for ultra-fast queries and deployed the live app via Streamlit Cloud from GitHub.
0
20
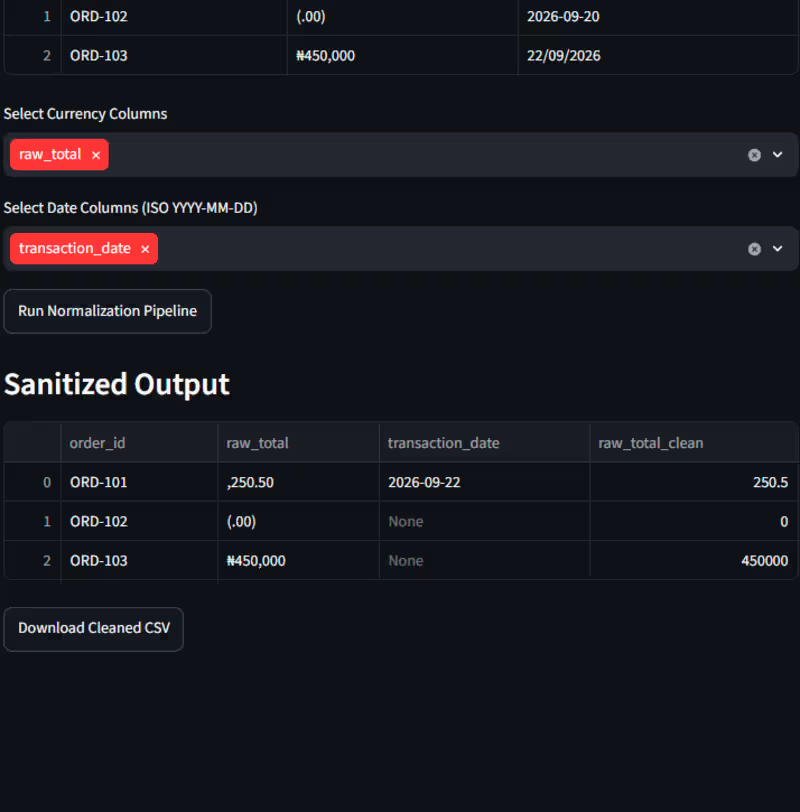
Automated Multi-Currency Data Cleaning & Normalization Web Application
Role: Data Analyst / Python Web Developer
Tools Used: Python, Streamlit, Pandas, Data Cleaning, Data Normalization
Project Overview:
Developed an interactive Python web application using Streamlit that automates the extraction, cleaning, and normalization of raw multi-currency transaction datasets.
Key Architecture & Execution Steps:
Raw Data Ingestion: Uploaded unformatted raw transaction records containing mixed currency symbols (e.g., ₦, ,, (.00)) and dates.
Interactive UI Configuration: Designed custom user dropdowns enabling users to select target currency and date columns for automated processing.
Data Sanitization Engine: Processed dirty strings into clean numeric float values using Pandas regex transformation pipelines (raw_total_clean).
Standardization & Export: Outputted standardized ISO-formatted sanitized data tables with immediate downloadable CSV capabilities.
0
21
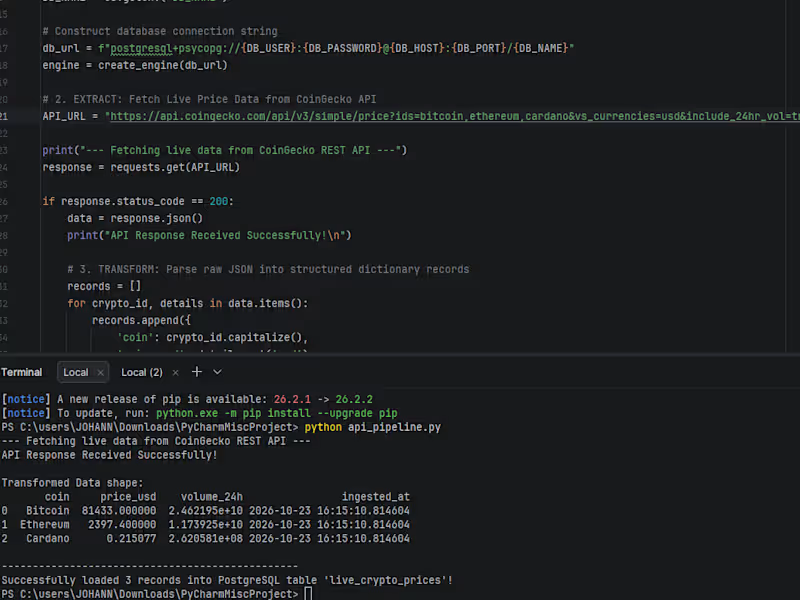
Live Cryptocurrency REST API & Containerized PostgreSQL Ingestion Pipeline
Role: Data Engineer / Backend Developer
Tools Used: Python, PostgreSQL, Docker, Pandas, SQLAlchemy, REST APIs
Project Overview:
Designed and deployed a production-ready Python data pipeline that ingests live market data from the CoinGecko REST API and loads structured records into a containerized PostgreSQL database.
Key Architecture & Execution Steps:
1. Extraction: Fetched real-time price and volume data using Python's requests library.
2. Transformation: Cleaned and formatted raw JSON payloads into structured Pandas DataFrames, adding automated ingestion timestamps.
3. Containerized Database Setup: Configured a local PostgreSQL database running inside a Docker container via Docker Compose.
4. Modern Database Connection: Connected Python directly to PostgreSQL using SQLAlchemy and the modern psycopg (v3) driver.
5. Security: Managed secrets securely using environment variables (.env).
0
29

Connecting code with intelligence





Data Scientist, Python, ML Engineer & AI Developer


Full-Stack Data Specialist | Automation & Predictive
Full-Stack Data Specialist | Automation & Predictive
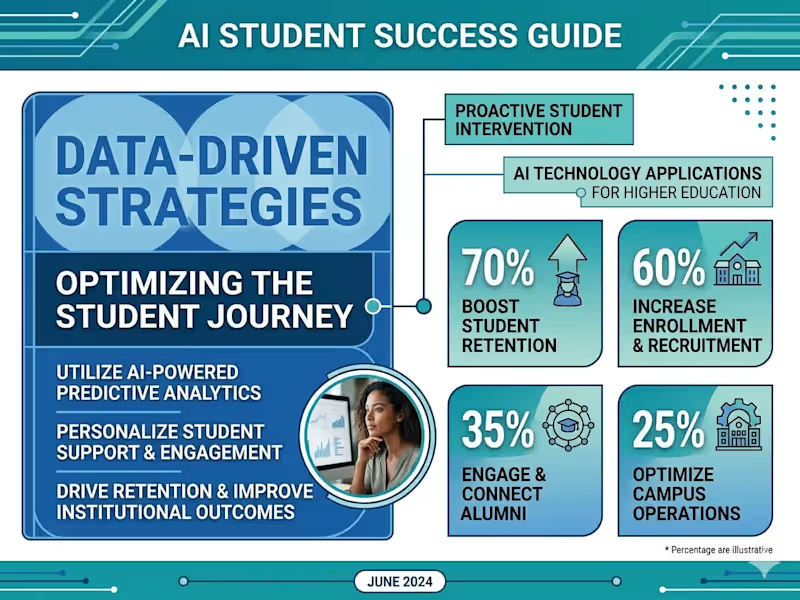
AI Student Success Intelligence Platform
A twelve‑module analytics platform analyzed 50,000 learners across six countries to predict dropout, model engagement, and simulate interventions, finding that a composite Student Engagement Index (SEI)—built from Time Commitment, Academic Quality, Platform Activity, and Social Learning—is the strongest predictor of dropout (behavior beats demographics), an ensemble of XGBoost/LightGBM/CatBoost achieved 99.72% AUC and F1 = 0.9522, risk tiers were highly precise (Low Risk = 0.0% dropout; Critical Risk = 99.7%), multi‑dimensional “Full Interventions” produced the largest simulated risk reductions, and correcting a data‑leakage issue (attendance proxy) was essential to preserve model integrity.
0
273

Crypto Market Intelligence & Alpha Signal Engine
An end-to-end Colab pipeline ingests market feeds, engineers 43 signals, detects regimes (KMeans/HMM/GMM), models 24‑hour alpha with a Random Forest (ROC‑AUC 0.7714), flags anomalies (Isolation Forest/Autoencoders), and backtests strategies; key findings: the SELL signal is highly precise (only 5.14% of SELLs rose next day), anomalies are often bullish (36.87% up vs 25.49% normal), price‑level context and regime probabilities drive predictions, and the model favors low‑volatility, defensive assets during downturns.
0
209
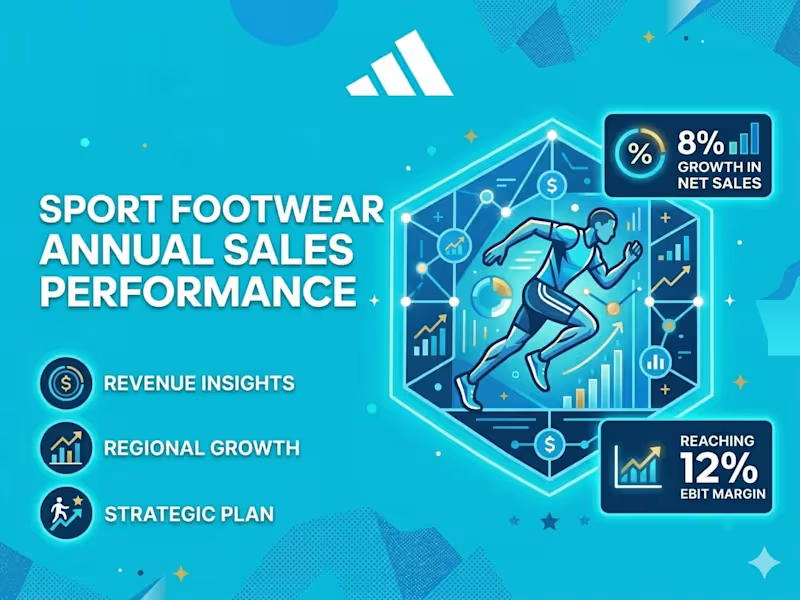
Global Retail Intelligence System: Product Success Prediction and Strategic Market Analysis
A multi-stage ML pipeline analyzed 44,888 Adidas SKUs using XGBoost and Random Forest to predict product success, demand trajectories, and stockout risk, finding that subcategory is the dominant success driver (~6× more explanatory than price, discount, or geography), the Success Classifier reached 94.3% accuracy and the Stockout Risk model 0.99 ROC‑AUC, 42.5% of products carry markdowns with deep discounts (≥30%) often eroding margins, 323 high-performing SKUs are under‑distributed and present near‑term expansion opportunities, the Budget tier outperforms Premium/Luxury in conversion to high performers, and 653 SKUs were flagged as high demand with elevated stockout risk requiring urgent replenishment.
0
166

AI-Driven Global Smartphone Sales Strategy Optimizer
An end-to-end ML project used four years of global sales data and 132,000+ simulations to optimize pricing across 52 countries, identifying the exact product, channel, and price to maximize profit. Key findings: the “Discount Myth”—discounting has almost no effect on volume but erodes margins; switching from blanket 20% discounts to AI‑optimized pricing yields a 15.1% revenue gain (about $73,993 preserved per simulation). The B2B channel is optimal in 90% of markets. The production XGBoost model achieves 99.73% accuracy, and ultra‑premium products (notably the Samsung Neo QLED 8K) consistently generate the highest revenue.
0
159

Power BI Expert | Turning Raw Data into Actionable Insights
Power BI Expert | Turning Raw Data into Actionable Insights
Data Analytics Project | BlinkIT Grocery Sales Analysis
Excited to share my latest Data Analytics project ,where I analyzed BlinkIT Grocery Sales Data and delivery data to uncover meaningful business insights 📈
📊 What I worked on:
Analyzed sales performance across product categories, outlet types, sizes, and locations
Identified top-performing item categories and customer preferences
Studied the impact of outlet size, establishment year, and visibility on sales
Converted raw data into actionable insights and business recommendations
💡 Key Insights:
Fruits & Vegetables, Snack Foods, and Frozen Foods drive maximum sales
FOR FULL PROJECT VIST GIT HUB –( https://lnkd.in/d34sdAPz
)
1
91
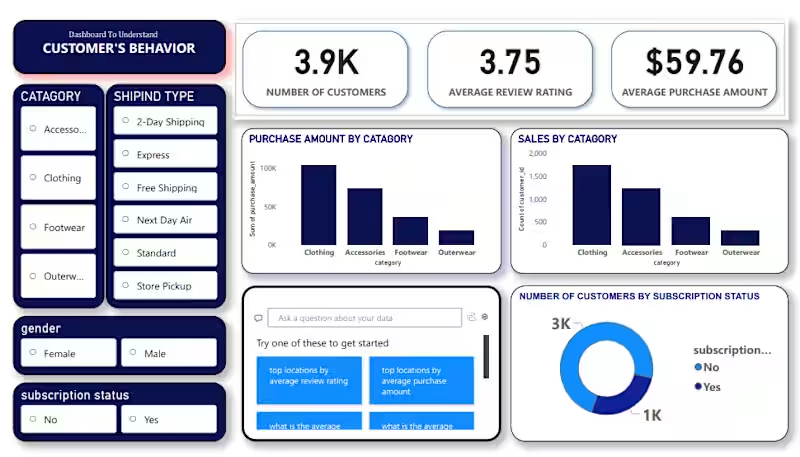
I’m excited to share my latest Data Analytics project where I analyzed Customer Shopping Behavior to uncover trends in sales, demographics, and purchasing habits.This project was a great exercise in building a complete data pipeline.
The Tech Stack:
Python (Pandas & NumPy): Used in Jupyter Notebooks for initial data exploration and statistical analysis.
PostgreSQL: Utilized for rigorous data cleaning, querying, and structuring the dataset for analysis.
Power BI: Built an interactive dashboard to visualize key metrics like seasonal trends, subscription impacts, and category performance.
Project Highlights:
✅ Data Cleaning: Leveraged PostgreSQL and Pandas to handle missing values and standardize categorical data.
1
2
124
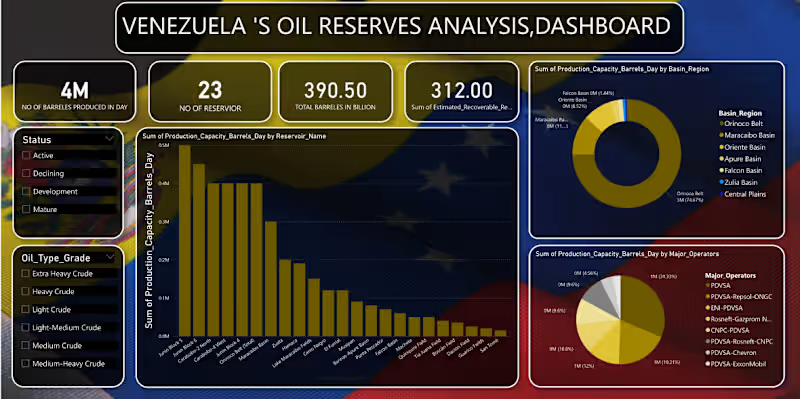
Venezuela’s Oil Reserves Analysis Dashboard 📊
I am excited to share my latest data analytics project focusing on the energy sector. Using a dataset covering 23 reservoirs, I designed a comprehensive dashboard to track production capacity and resource distribution in Venezuela.
Key Features: ✅ Real-time Metrics: Tracking the 390.50 Billion total barrels in reserve. ✅ Granular Analysis: Production capacity breakdown by reservoir name and oil grade (Extra Heavy to Light). ✅ Stakeholder Mapping: Visualizing the production sum by major operators.
Tools Used: [pandas(jupyter notebook)/mysql(for analysis and cleaning of data), Power BI / Excel(for building dashboard)]
I’d love to hear your thoughts or feedback on the dashboard design!
must visit my github for full project -( https://lnkd.in/dYKdZ8J2
)
0
105
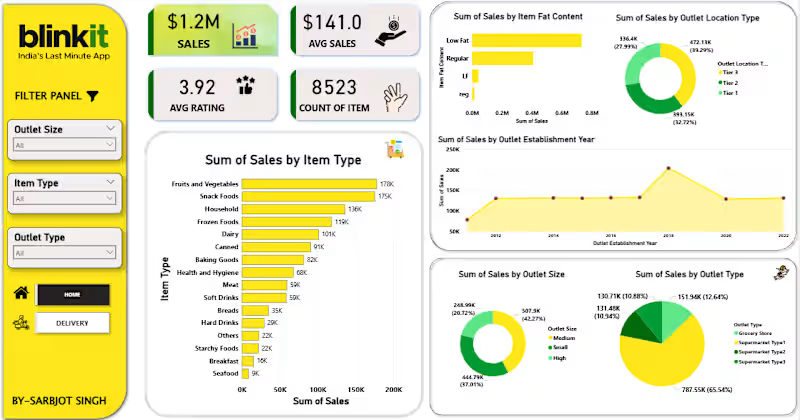
Data Analytics Project | BlinkIT Grocery Sales Analysis
Excited to share my latest Data Analytics project ,where I analyzed BlinkIT Grocery Sales Data and delivery data to uncover meaningful business insights 📈
📊 What I worked on:
Analyzed sales performance across product categories, outlet types, sizes, and locations
Identified top-performing item categories and customer preferences
Studied the impact of outlet size, establishment year, and visibility on sales
Converted raw data into actionable insights and business recommendations
💡 Key Insights:
Fruits & Vegetables, Snack Foods, and Frozen Foods drive maximum sales
Medium-sized outlets outperform others in overall revenue
FOR FULL PROJECT VIST GIT HUB –( https://lnkd.in/d34sdAPz
)
Feedback and suggestions are always welcome!
1
1
121