Data Analysis Projects in Accra
Data Analysis Projects in Accra
Sign Up
Post a job
Sign Up
Log In
Filters
2
Projects
People
Message
0
Anjana Maniyote
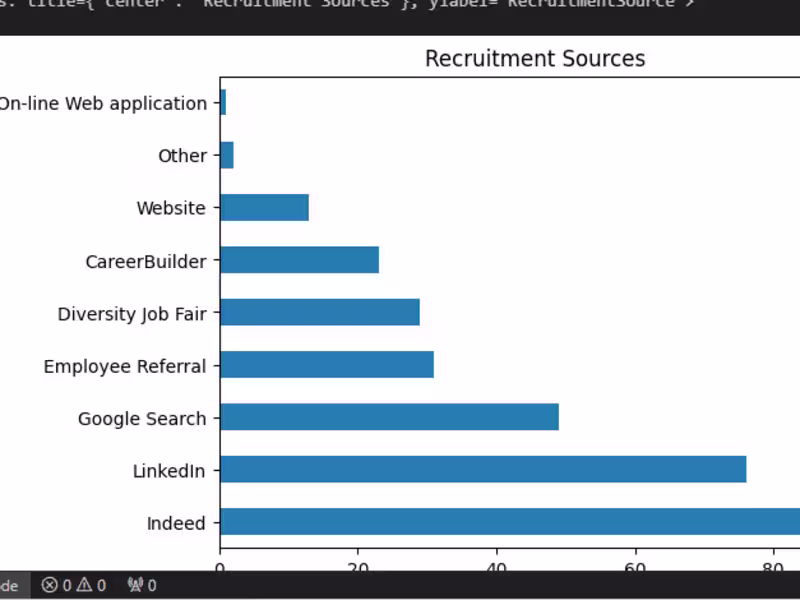
amaniyote/HR-Salary-Prediction
0
75
Message
1
Joas Pambou
Health Diagnosis System
1
15
Message
0
Mariam Lawal
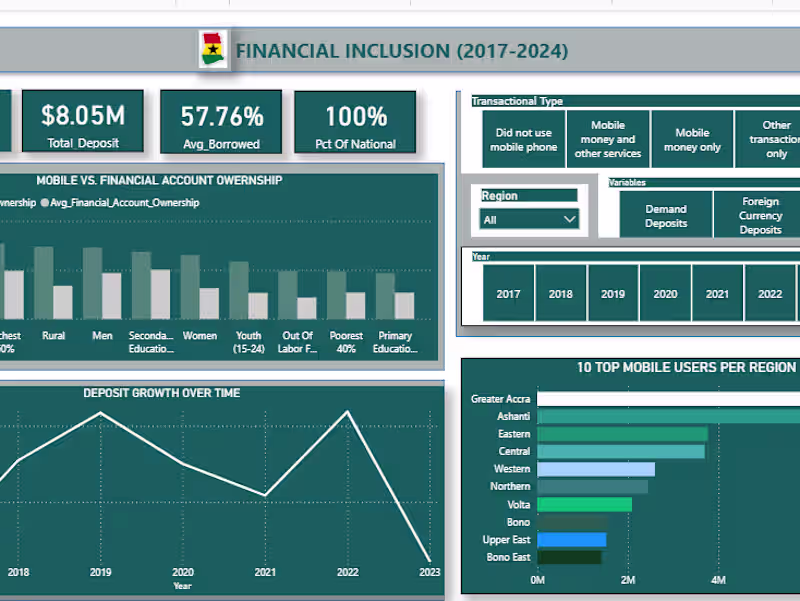
Ghana Financial Inclusion Analysis (2017–2024)
0
1
Message
0
Emmanuel Antiri
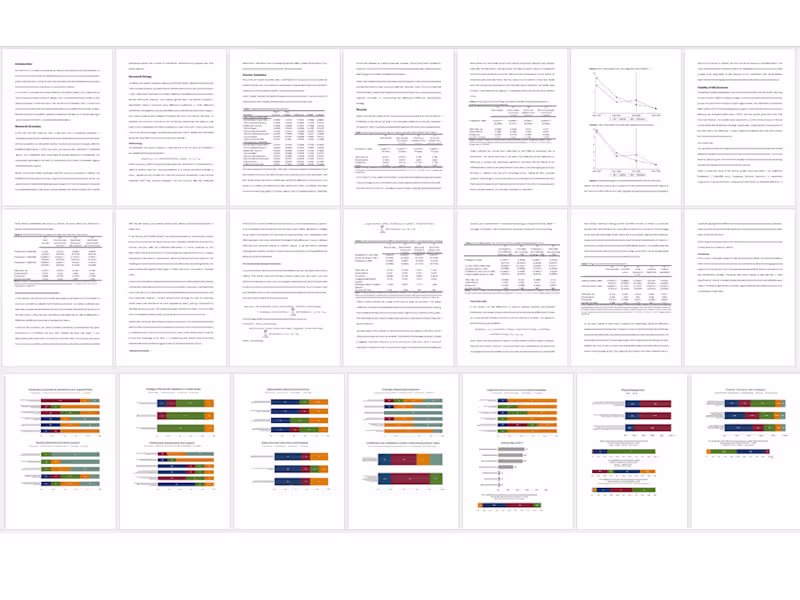
Impact of new Educational Policy on Quality Tuition
0
0
Message
0
David Praise Francis-Omogbai
GitHub - Tonyflam/Data_Analysis_and-visualization
0
8
Message
0
Anjana Maniyote
TCS-iON-RIO-125-HR-Salary-Dashboard---Train-the-Dataset-and-Pre…
0
86
Message
0
Joas Pambou
Writing Technical Articles on Emerging Technologies
0
5
Message
0
Mariam Lawal
Revenue Performance Analysis Project
0
1
Message
0
Anjana Maniyote
amaniyote/Car-Insurance-Claim-Prediction
0
12
Message
0
Joas Pambou
Customer Churn Prediction with ABC Bank dataset
0
42
Message
1
Mariam Lawal
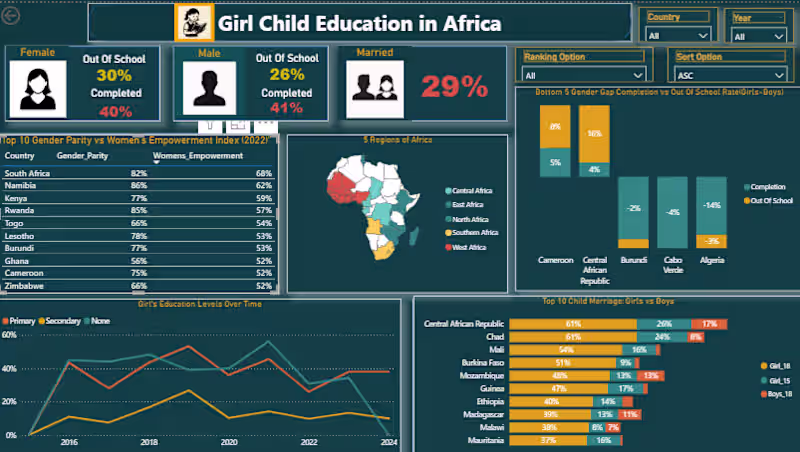
Power BI Dashboard on Girl Child Education in Africa
1
0
Message
0
Mariam Lawal
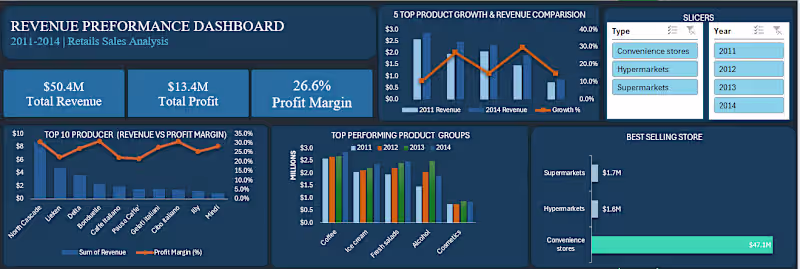
Excel Data Analytics Project | Revenue Performance Dashboard I built an interactive Revenue Performance Dashboard in Excel to analyze revenue, profit, and product performance across multiple years (2011–2014). 🔍 Key Insights from the Analysis: 1.North Cascade consistently led revenue generation, making it the primary growth driver across all years. 2.Coffee (http://2.Coffee) and Fresh Salads emerged as the top performing product groups, contributing the highest share of total revenue. 3. Convenience Stores generated the highest total revenue , indicating strong market reach. 4.Supermarkets recorded the strongest profit margins ,reflecting higher efficiency in cost and pricing structures. 5.Despite revenue growth over time, profit margins remained relatively stable (~26–28%), suggesting controlled cost structures rather than aggressive price increases. 6.A small number of products recorded negative margins, signaling pricing or cost inefficiencies that require attention. 📌 Strategic Recommendations 1.Increase investment in high-performing categories (e.g., Coffee). 2.Strengthen distribution through Convenience Stores to maximize revenue reach. 3.Reassess low-margin product pricing strategies. 4.Implement customer feedback systems to improve product positioning. 🛠 Tools & Skills Demonstrated: Microsoft Excel (Pivot Tables, Pivot Charts, Slicers) Data cleaning and transformation KPI design and dashboard storytelling Business performance and trend analysis This project reflects my approach to analytics: turning raw data into clear, actionable insights for decision-making.
0
25
Explore projects