Global Healthy Diet Cost Analysis (2017–2024)
Aaron Tawiah
🌍 Global Healthy Diet Cost Analysis (2017–2024)
📌 Executive Summary
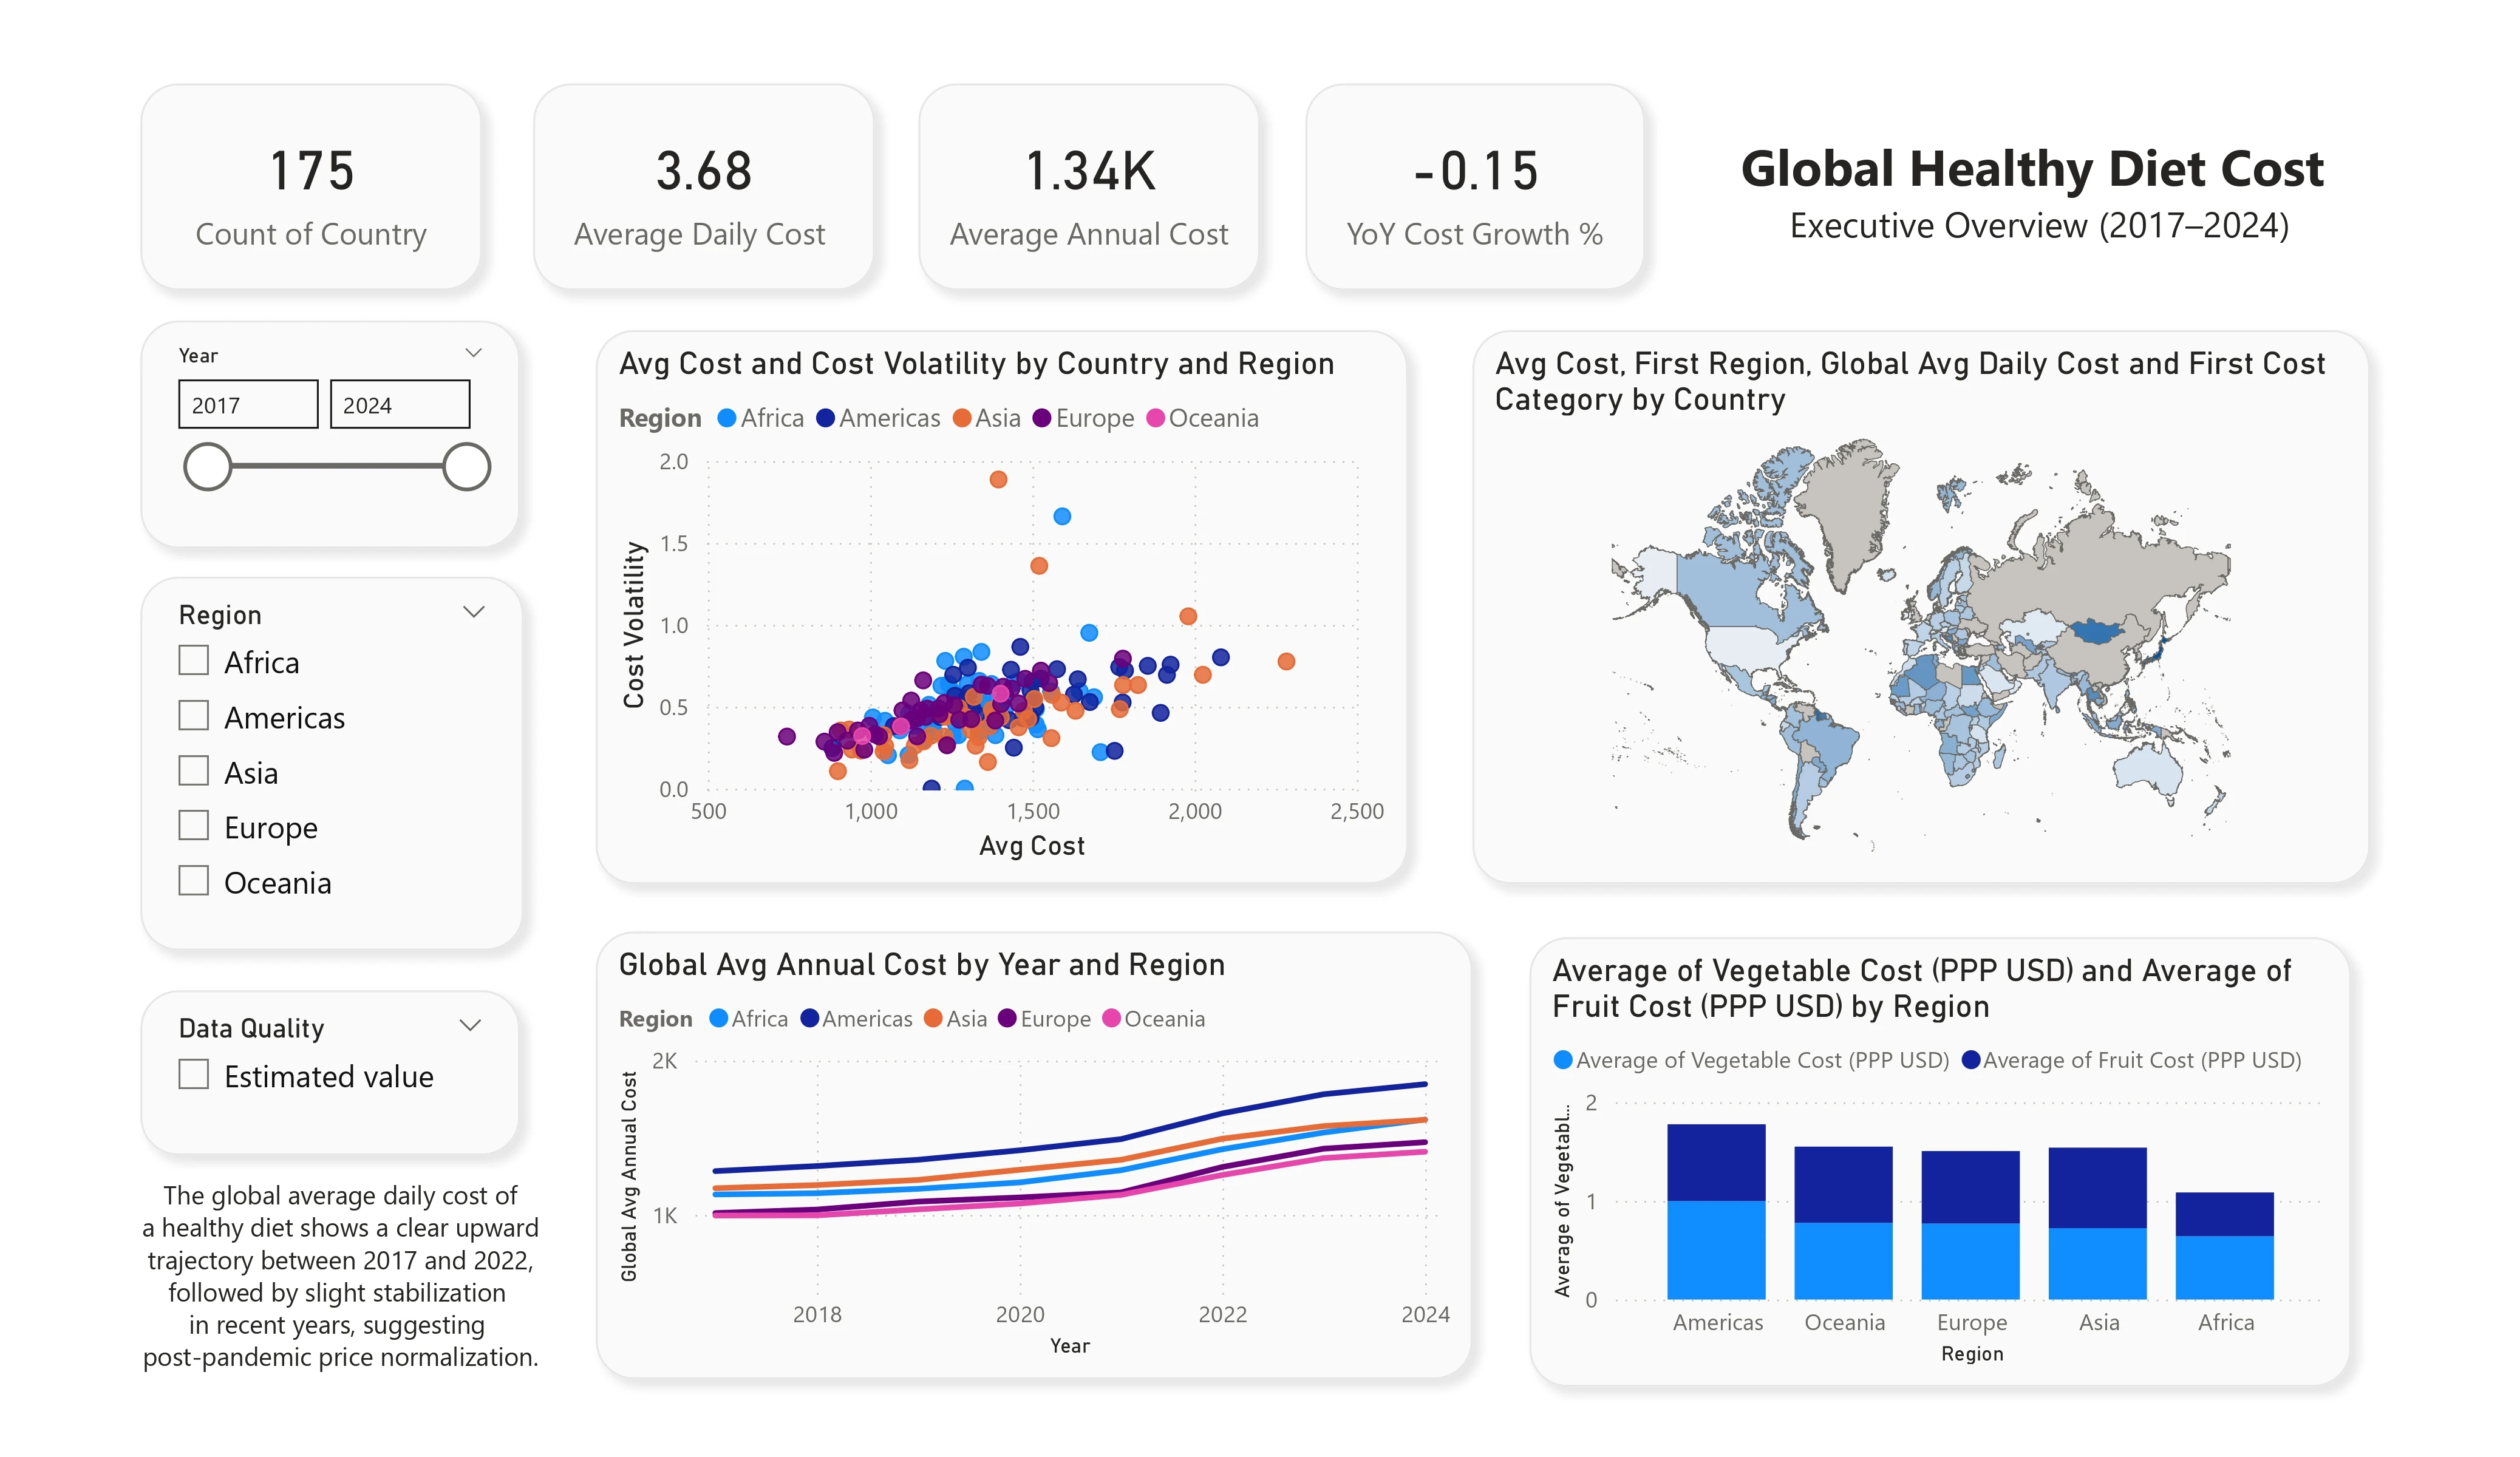
This project analyzes the global cost of a healthy diet across 170+ countries between 2017 and 2024 using FAO and World Bank data.
The objective is to assess affordability trends, regional disparities, volatility exposure, and diet component cost drivers that influence global food security and economic policy.
🎯 Business & Policy Objectives
Evaluate global healthy diet cost trends over time
Identify high-cost and high-volatility regions
Measure structural shifts post-pandemic (2020–2022)
Analyze the contribution of fruit and vegetable costs to total diet expenses
Provide policy-relevant affordability insights
🛠 Tools & Technologies
Power BI – Data modeling, DAX measures, dashboard design
Excel – Data cleaning & preprocessing
DAX – Calculated measures (YoY Growth, Volatility, Averages)
Data Visualization & Storytelling
📊 Key Analytical Insights
Healthy diet costs increased sharply between 2020–2022, reflecting global supply chain disruptions.
Post-2022 stabilization does not indicate improved affordability — cost levels remain structurally elevated.
The Americas and Asia consistently record higher average diet costs.
Volatility patterns suggest varying exposure to global economic shocks.
Fruit pricing contributes disproportionately to total cost fluctuations.
📸 Dashboard Preview
Executive Overview
Regional Cost Disparities
Time & Volatility Analysis
Diet Component Breakdown
📂 Repository Structure
Global-Healthy-Diet-Cost-Analysis-2017-2024 │
├── price_of_healthy_diet_clean.csv
├── Global Healthy Diet Cost.pbix
├── Global Healthy Diet Cost.pdf
├── executive-overview.png
├── regional-disparities.png
├── volatility-analysis.png
└── component-breakdown.png
📈 Dataset Description
Column Description country Country name region Geographic region year Observation year (2017–2024) cost_healthy_diet_ppp_usd Daily cost (PPP USD) annual_cost_healthy_diet_usd Annual estimated cost cost_fruits_ppp_usd Daily fruit cost cost_vegetables_ppp_usd Daily vegetable cost cost_category High / Medium / Low cost classification data_quality Observed or Estimated
🌐 Data Source
Food and Agriculture Organization (FAO)
World Bank
Cost of a Healthy Diet (PPP USD, 2017 baseline)
👤 Author
Aaron Tawiah
Data Analyst | Power BI | SQL | Excel
Economic & Policy Data Analysis
🔗 Connect on LinkedIn (https://www.linkedin.com/in/aaron-tawiah-171285171/)
Like this project
Posted Jun 22, 2026
Analyzed global healthy diet costs across 170+ countries from 2017–2024 using Power BI and Excel.
Likes
0
Views
1