Revenue Performance Analysis Project
Mariam Lawal
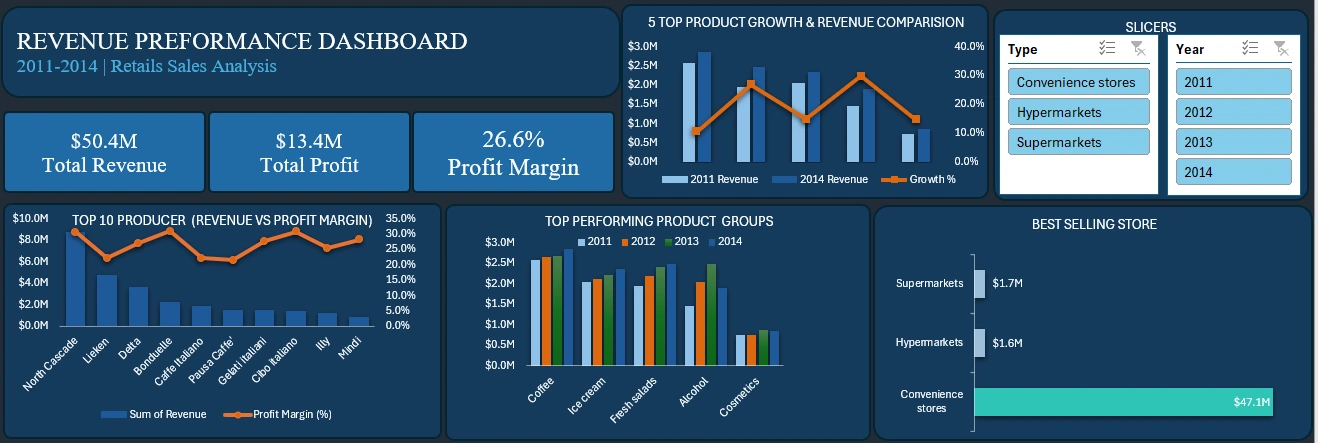
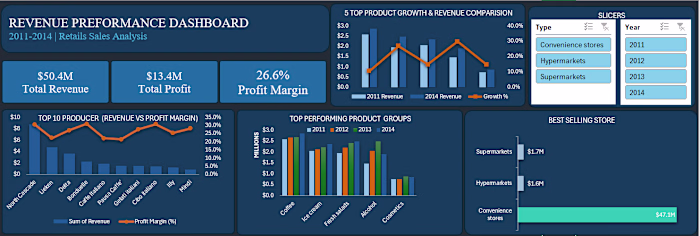
Revenue Performance Analysis | Excel Dashboard
Project Overview
This project analyzes revenue and profitability trends from 2011 to 2014 using Microsoft Excel.
The goal was to transform raw sales data into clear business insights on product performance, store efficiency, and profit trends through data cleaning, KPI development, and dashboard visualization.
Business Objective
Identify top-performing product groups Determine best-performing store types Evaluate producer contribution to revenue Analyze profitability trends over time Provide data-driven recommendations for growth
Data Preparation and Cleaning
Handled missing values in volume and revenue fields Applied median imputation (816) due to right-skewed distribution Recalculated revenue using: Revenue = Price × Volume Removed irrelevant ID and code columns Validated consistency across revenue, profit, and margin
SQL (Conceptual Design)
Designed a relational database schema for the revenue dataset Wrote sample SQL queries to demonstrate how the dataset would be structured in a MySQL database Defined appropriate data types such as INT, VARCHAR, and DECIMAL Structured fields for analysis including year, store type, product group, producer, volume, pricing, and revenue
Key Insights
Coffee generated the highest revenue across all years North Cascade was the strongest revenue contributor Convenience stores had the highest overall profitability Supermarkets recorded the strongest profit margins Average profit margin remained stable at 26 to 28 percent 2014 recorded the highest revenue performance
Strategic Recommendations
Increase investment in high-performing products such as coffee Expand distribution through convenience store channels Review pricing strategies for low-margin products Use customer feedback to improve product positioning
Tools and Skills Demonstrated
Microsoft Excel: Data cleaning, transformation, and dashboard development KPI development for revenue, profit, and performance tracking Pivot tables for trend analysis and business insights Data validation to ensure accuracy across key financial metrics
Dashboard Preview
Repository Contents
Revenue_Performance_Analysis.xlsx Contains raw data, cleaned data, pivot analysis, KPI calculations, and dashboard
Like this project
Posted Apr 1, 2026
Analyzed revenue and profitability trends from 2011-2014 using Excel.
Likes
0
Views
2