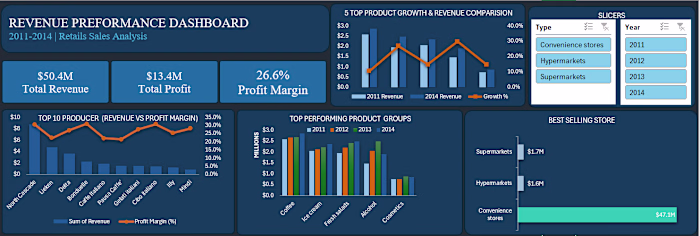
Power BI Dashboard on Girl Child Education in Africa
Mariam Lawal
Girl Child Education in Africa – Data Analytics Project
A data-driven investigation into gender gaps, child marriage, and educational inequality across Africa.
Project Overview
This project analyzes gender disparities in education across Sub-Saharan Africa using data on child marriage, school completion, and out-of-school rates.
The aim is to identify key drivers of educational inequality and provide data-driven insights to support policy, advocacy, and intervention strategies.
Business Question
What factors drive gender inequality in education across Africa, and how do child marriage, poverty, and location affect girls’ access to education?
Key Insights
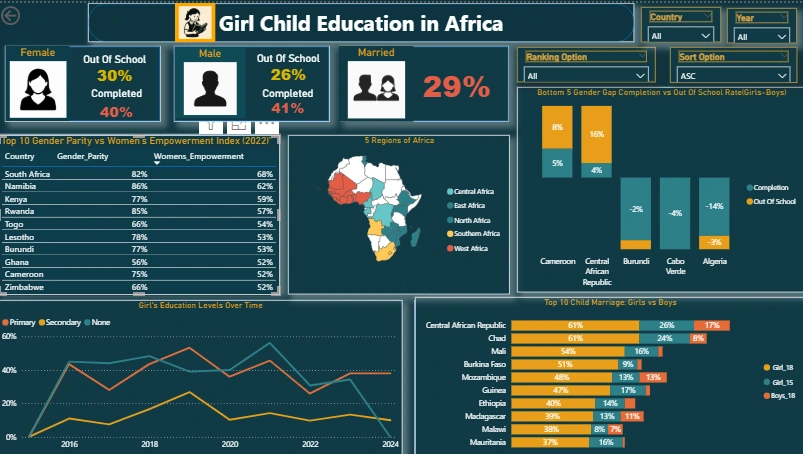
30% of girls are out of school compared to 26% of boys. Child marriage rates reach 50 to 61 percent in countries such as Chad and CAR, while boys remain below 10 percent. The highest dropout risk occurs between ages 15 and 18. Children from the poorest households show 45 percent exclusion compared to 13 percent in the richest. Rural areas show lower school attendance compared to urban areas.
Objectives
Measure gender gaps in school attendance and completion Compare girls’ and boys’ education outcomes across countries Analyze the impact of child marriage on education Evaluate disparities across wealth groups and location Support policy and advocacy using data insights
Data Sources
The dataset was obtained from publicly available sources, including Kaggle.
The data originates from:
UNICEF (MICS). World Bank (World Development Indicators). Demographic and Health Surveys (DHS). USAID. UNESCO Institute for Statistics.
Data Scope
Filtered dataset to include only African countries. Focused analysis on gender inequality and girls’ education within the African context. Enabled relevant comparisons across countries with similar socioeconomic conditions.
Data Quality and Preparation
Identified missing values across key indicators. Replaced missing values with 0 where appropriate and ensured consistency across datasets. Cleaned and standardized variables across countries and years. Integrated multiple datasets into a unified structure. Validated data to ensure accuracy for analysis.
Data Workflow and Tools Used
Excel
Identified missing values across key indicators. Replaced missing values with 0 where appropriate and ensured consistency across datasets. Cleaned and standardized variables across countries and years. Integrated multiple datasets into a unified structure.
SQL (MySQL)
Designed database schema for structured analysis. Organized datasets for efficient querying.
Power BI
Imported JSON file to create a custom Shape Map for African country visualization. Connected and transformed data using Power Query. Created a dimensional data model with 5 relationships between tables. Built 41 DAX measures using CALCULATE, AVERAGE, SUM, and DISTINCTCOUNT. Analyzed disparities across gender, wealth groups, location (urban vs rural), and education levels. Developed KPIs for out-of-school rates, completion gaps, gender parity, and child marriage. Designed interactive dashboards with filtering by country, gender, and time.
Dataset Summary
Child Marriage rates by gender (ages 15 and 18) Out-of-School rates by gender, location, and wealth School completion rates (primary and secondary) Gender Parity Index Women Empowerment Index
Dashboards
Dashboard 1 — Girl Child Education in Africa
Dashboard 2 — Educational Inequality & School Exclusion
Key Findings
Gender inequality in education is strongly linked to early marriage Poverty significantly increases school exclusion rates Rural populations face higher barriers to education access Gender parity does not always reflect equal access due to data gaps
Recommendations
Strengthen policies to reduce child marriage in high-risk countries Expand access to education in rural and low-income communities Invest in girls’ education programs targeting ages 15 to 18 Improve data collection to address gaps in gender-based reporting
📌 Important nuance:
Countries like South Africa and Namibia show high gender parity and empowerment scores, yet gender-tagged education data is incomplete — a reminder that parity statistics do not always equal to access, and data gaps are part of the challenge.
🧠 Why This Matters
Educated girls are more likely to: ✔ Delay marriage ✔ Earn independently ✔ Escape poverty ✔ Lead in community & politics ✔ Create generational change
Project Structure
girl-child-education-africa/
data/
raw: original datasets cleaned: processed datasets
dashboard/
Power BI report files
sql/
database schema
README.md
Acknowledgement
Developed as part of an internship with ThriveAfrica (FutureOfWork).
Like this project
Posted Apr 1, 2026
A Power BI dashboard analyzing gender parity and education trends across African countries.
Likes
1
Views
0