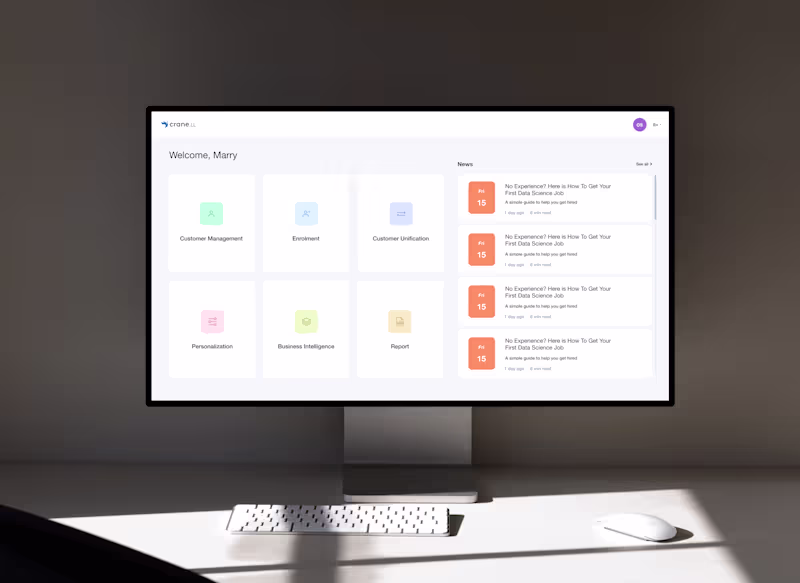
Data Visualization Projects in İstanbulData Visualization Projects in İstanbulPower BI Sales Analytics Dashboard (4 pages)
🔗 Live Preview: View the interactive dashboard before purchase https://app.powerbi.com/view?r=eyJrIjoiYjcwNWE2OWYtM2ViZi00NDc5LTlmMTgtZWMzN2IxN2JkYTY1IiwidCI6IjYyZTI4NmIzLWE4ZDMtNDFkYS04Y2E4LWUwNzFhZTMxZGUwMiIsImMiOjl9&pageName=cd07523f864688ce9c1b
Sale on Contra https://contra.com/products/gOrTVHYk-power-bi-sales-dashboard-or-editable-sales-analytics-template
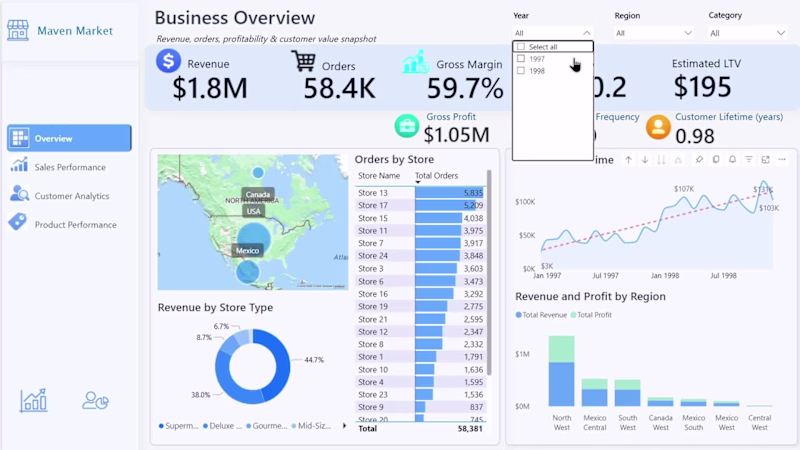
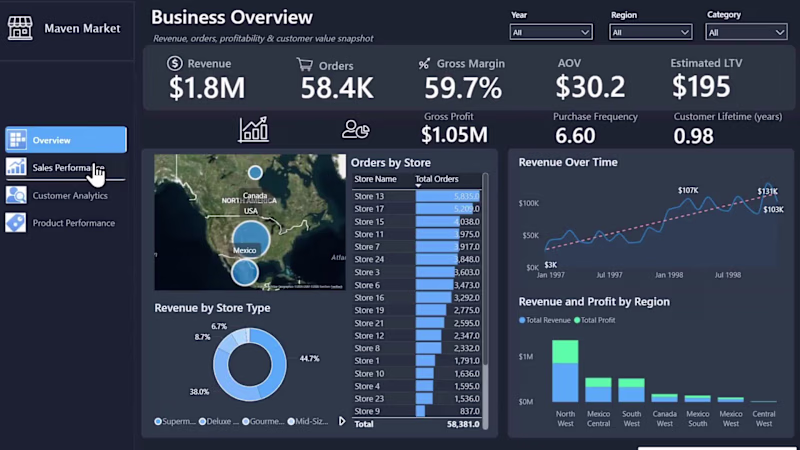
Designed to help you analyze revenue, sales performance, customer behavior, and product insights in one professional report. This editable template includes 4 interactive pages with modern visuals, KPI tracking, and dynamic filtering.
✨ What makes this dashboard special? • Clean and professional design suitable for any business • Fully editable Power BI (.pbix) file included • 4 ready-to-use pages: Business Overview, Sales Performance, Customer Analytics, Product Performance • Interactive filters and drill-down capabilities • Sample dataset included for easy customization • Perfect for portfolio, business analysis, or client reporting Retail Revenue & Customer Insights Dashboard (Power BI)
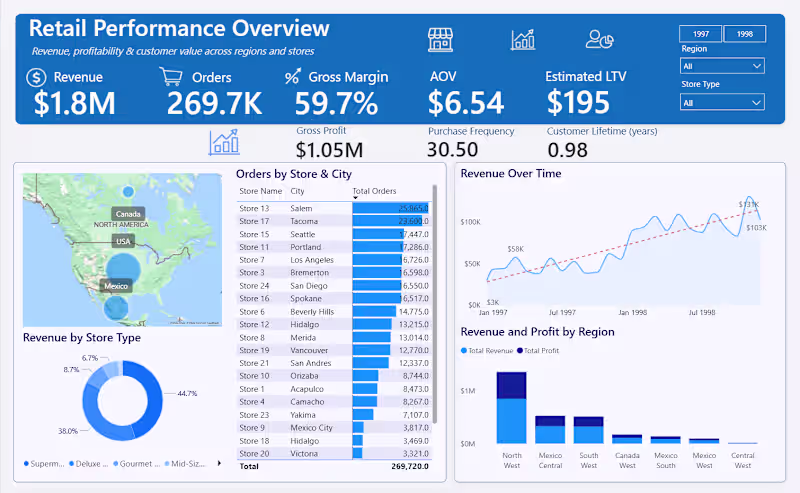
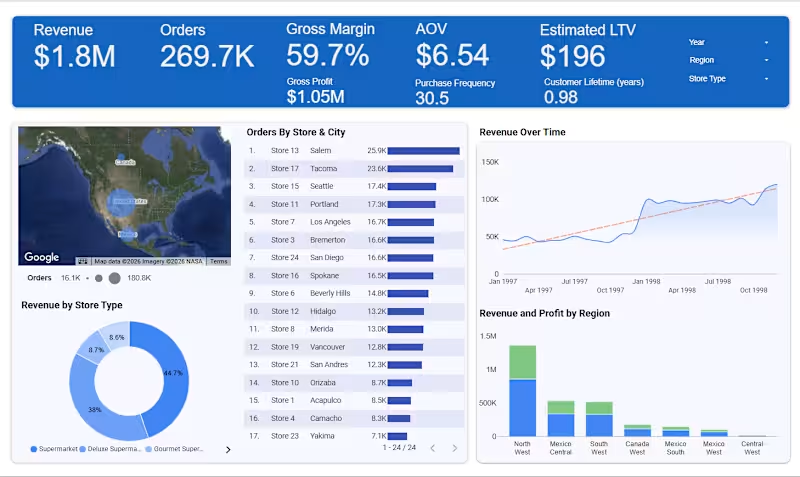
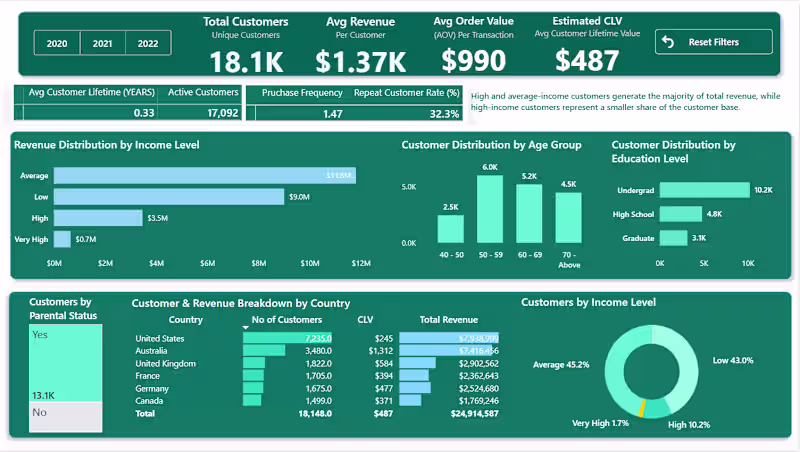
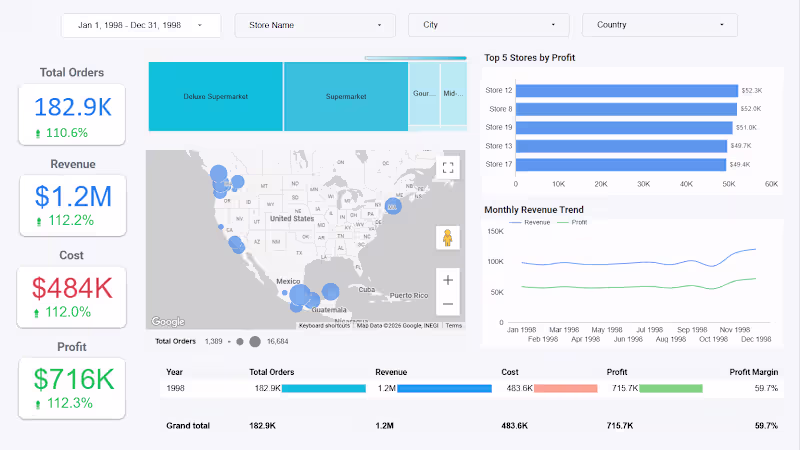
This Power BI dashboard provides a comprehensive view of retail performance, combining revenue, orders, margin, and customer value metrics in a single executive-ready report.
It enables stakeholders to track sales trends over time, analyze regional performance, and understand customer behavior through KPIs such as AOV, purchase frequency, and estimated lifetime value.
The report is designed for fast decision-making, featuring automated filtering, geographic insights, and clean visual hierarchy suitable for leadership and operational teams.
Built with scalable data modeling and designed to support automated refresh and alerting workflows.