The network for creativity
Join 1.25M professional creatives like you
Connect with clients, get discovered, and run your business 100% commission-free
Creatives on Contra have earned over $150M and we are just getting started
Back to feedPost
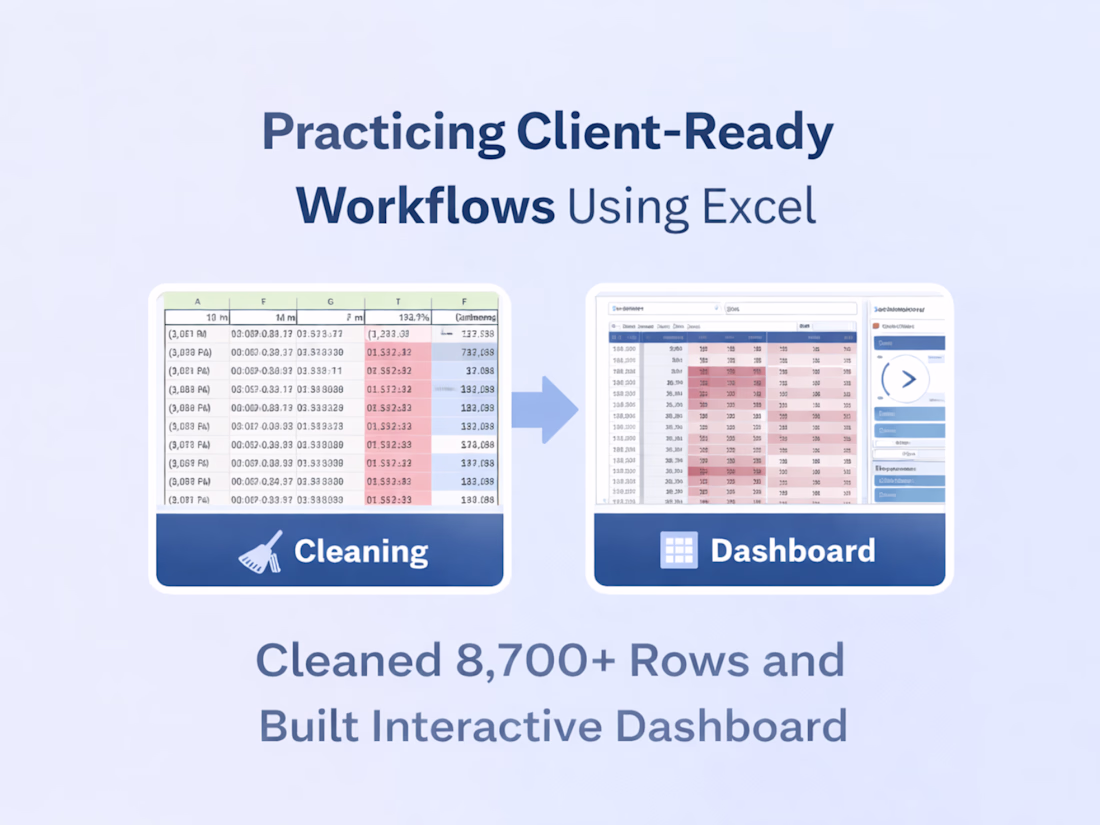
Turning messy Excel data into an interactive dashboard 📊
In my latest Excel case study, I worked with a raw, unstructured dataset (8,700+ rows) and focused on doing the fundamentals right:
• Cleaned inconsistent time, date, and text values
• Structured the data for accurate analysis
• Built pivot tables with day, month, and time logic
• Added slicers and conditional formatting for interactivity
No fancy tools — just solid Excel workflows that make data reliable and easy to explore.
This is exactly how I approach real client data:
clean first → structure next → visualize last.
👉 Full case study is live on my profile.
Good keep it up like that..
Thank you for the support😊
Thank you 😊
Thank you😊
The network for creativity
Join 1.25M professional creatives like you
Connect with clients, get discovered, and run your business 100% commission-free
Creatives on Contra have earned over $150M and we are just getting started
Related posts
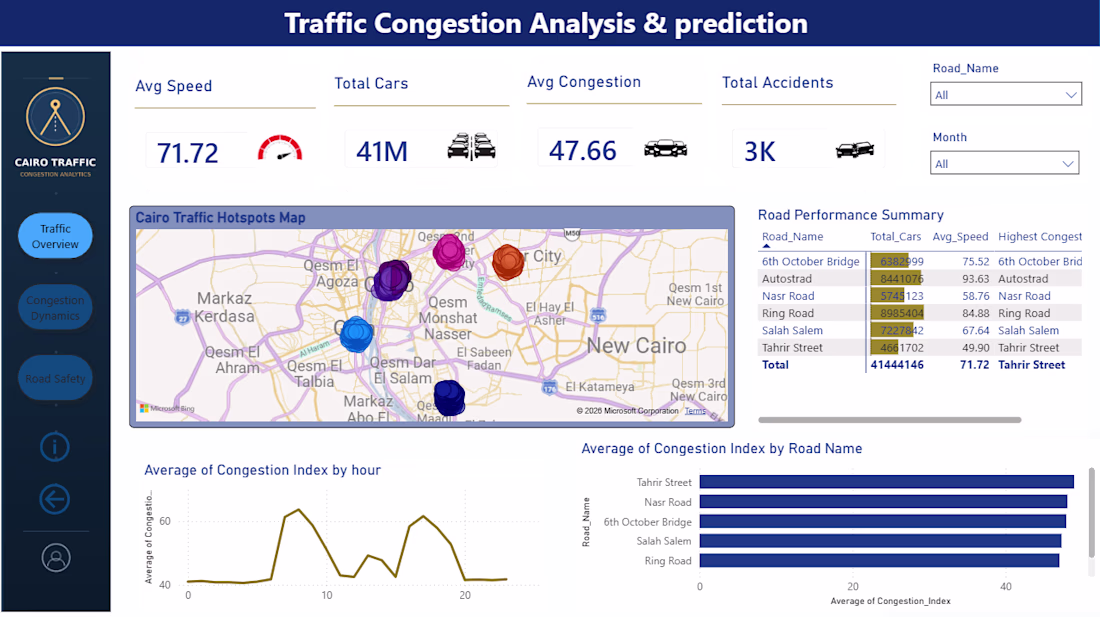
Excited to share my latest data analytics project: Traffic Congestion Analysis & Prediction. 🚗📊
This end-to-end project involved processing complex traffic data to derive actionable insights, including:
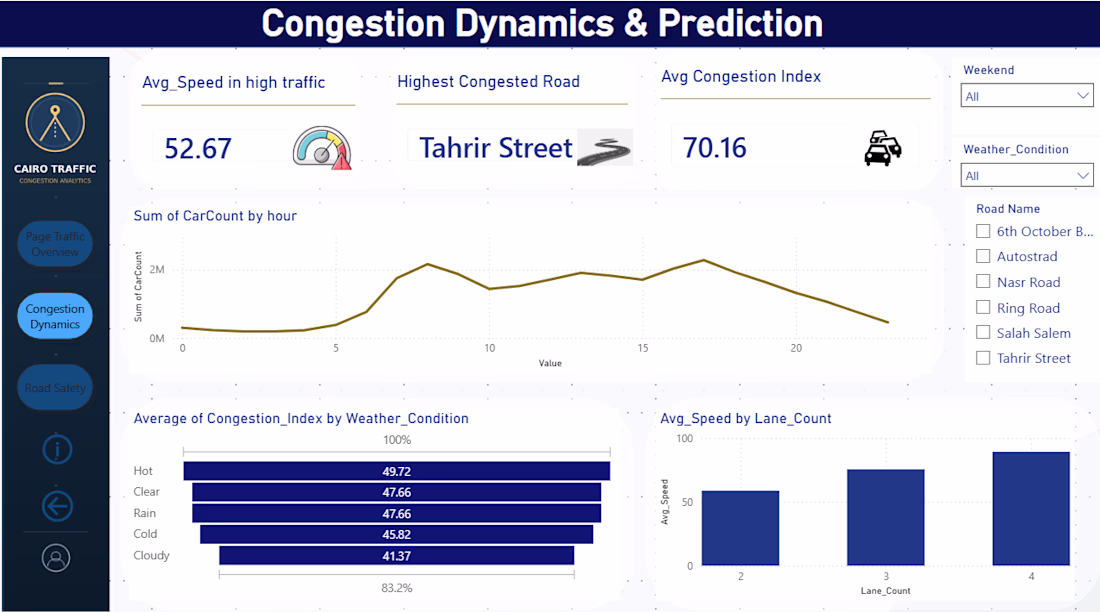
Visualizing traffic hotspots and congestion trends across Cairo.
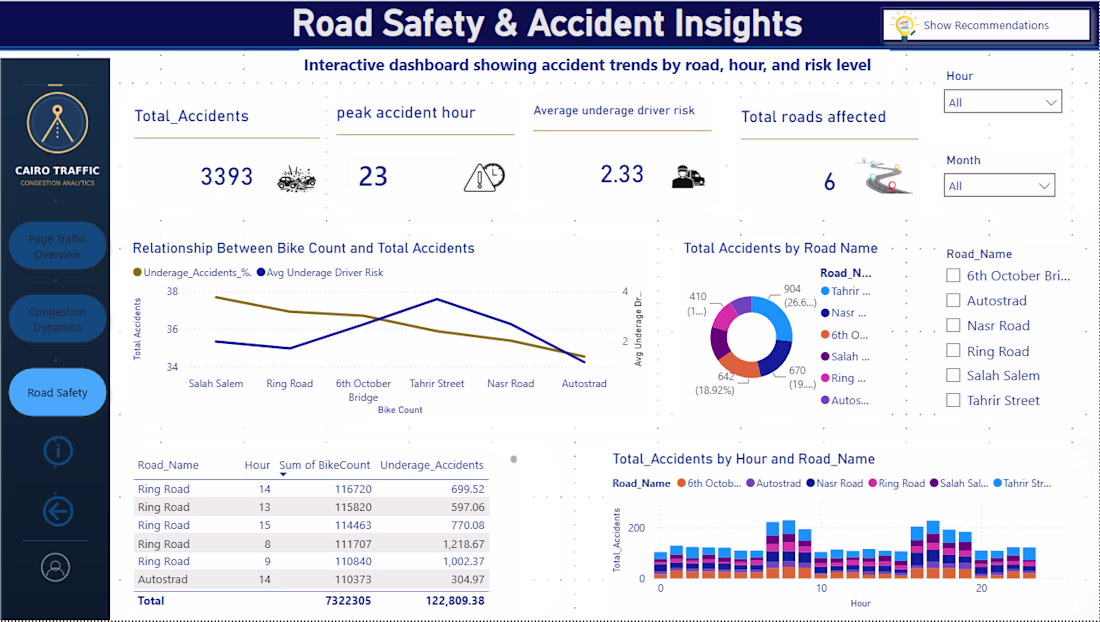
Analyzing accident risk factors related to road types, hours, and underage drivers.
Building an interactive dashboard to support data-driven urban planning.
Tools used: Power BI, DAX, and advanced data visualization techniques.
Check out the snapshots below and let me know your thoughts! Always happy to discuss data-driven solutions. 💡
Access the full project and source code here: [https://github.com/Hazemkhaled278/Traffic-Congestion-Analysis-Prediction- ]
#DataAnalytics #PowerBI #TrafficAnalysis #DataScience #Freelance #Traffic"
The hotspot map alongside the prediction dashboard is a great combo, turns raw congestion numbers into something a city planner could actually act on. Was the traffic data public/open source, or did you have to piece it together from multiple sources?
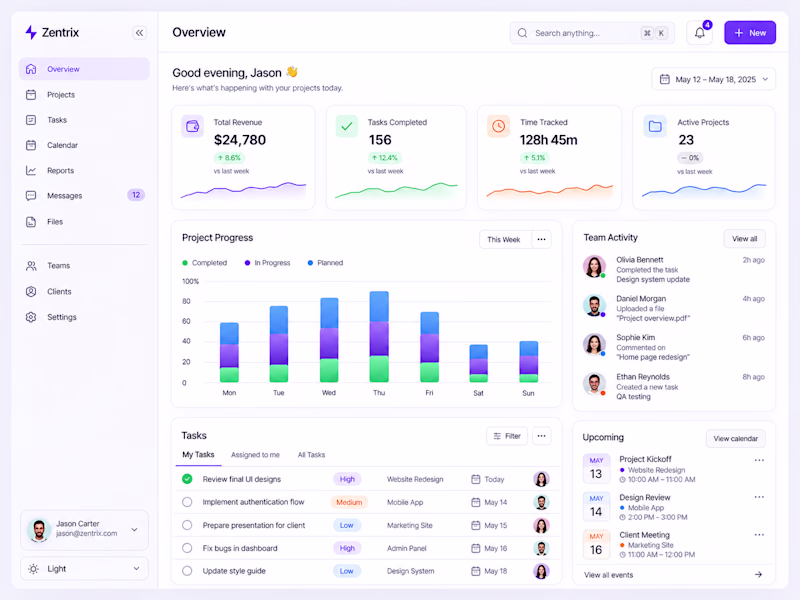
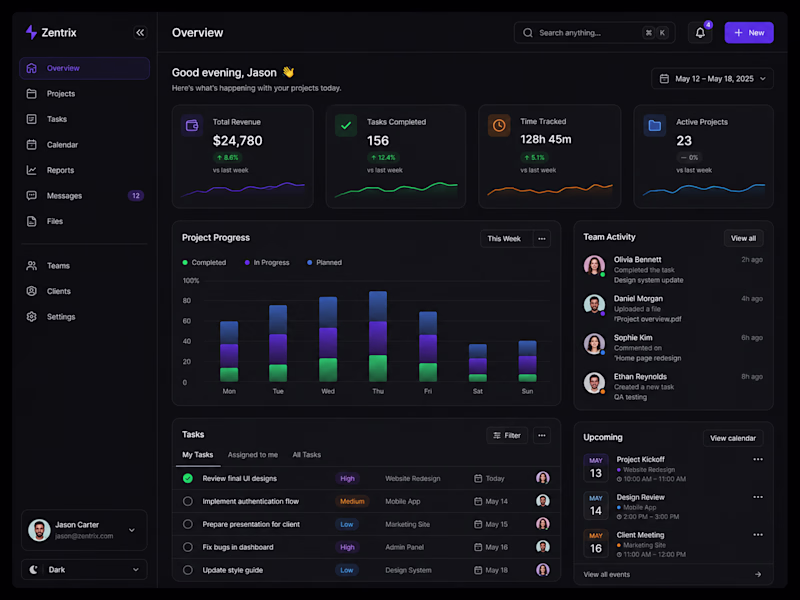
If you had to use the same dashboard every day... 👀
🅰️Dark Mode
🅱️ Light Mode
What's your pick? 👇
7 voted
47%
8 voted
53%
15 votes
Closed
For everyday use light is just too Much to handle
Workforce Activity Overview – Mobile Dashboard Widget
This mobile activity widget was designed to help employees and managers understand yearly work patterns without opening a full dashboard. It brings together total logged hours, annual leave, sickness, training and project activity in one clear view, using strong hierarchy and restrained corporate colours to make the information easy to scan.
The simplified layout could reduce the time needed to review an employee’s activity from several minutes to under 30 seconds. Managers can identify unusual absence levels, check workload distribution and prepare performance reviews faster, while employees gain a clearer understanding of how their recorded time has been allocated.
That yearly summary view is such a smart addition, most time trackers stop at weekly reports and leave you to do the math yourself. Did the Jitter integration require much custom mapping or was it fairly plug and play?
Trending
Claude
Claude has entered the design space. How are you using Claude Design?
Contra University
Learn from expert creatives how to earn more using next-gen AI tools.
creativeaiflow
Creative AI workflows are evolving. What tools do you use, and what are their strengths and weaknesses?
freelancerlife
Freelancer life is wins, pivots, and everything in between. What’s yours right now?