The network for creativity
Join 1.25M professional creatives like you
Connect with clients, get discovered, and run your business 100% commission-free
Creatives on Contra have earned over $150M and we are just getting started
Back to feedPost
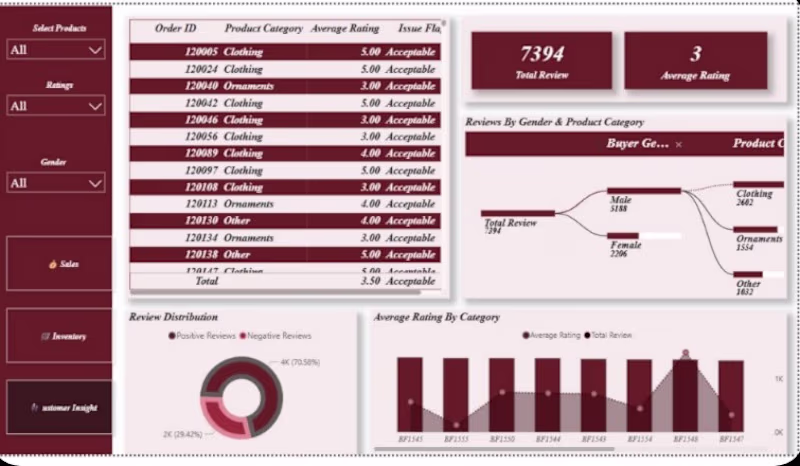
Service Performance & Cost Optimization Dashboard
This dashboard analyzes service performance, operational costs, and revenue trends to help businesses understand profitability and efficiency.
Key features:
• KPI overview including total cost, net loss, and work orders
• Monthly revenue and cost trend analysis
• Service efficiency and order performance metrics
• Geographic insights through a US performance map
• Technician workload and top performer tracking
Tools used:
Excel for data processing and dashboard design.
Purpose:
This dashboard helps businesses quickly identify cost drivers, performance trends, and operational inefficiencies.


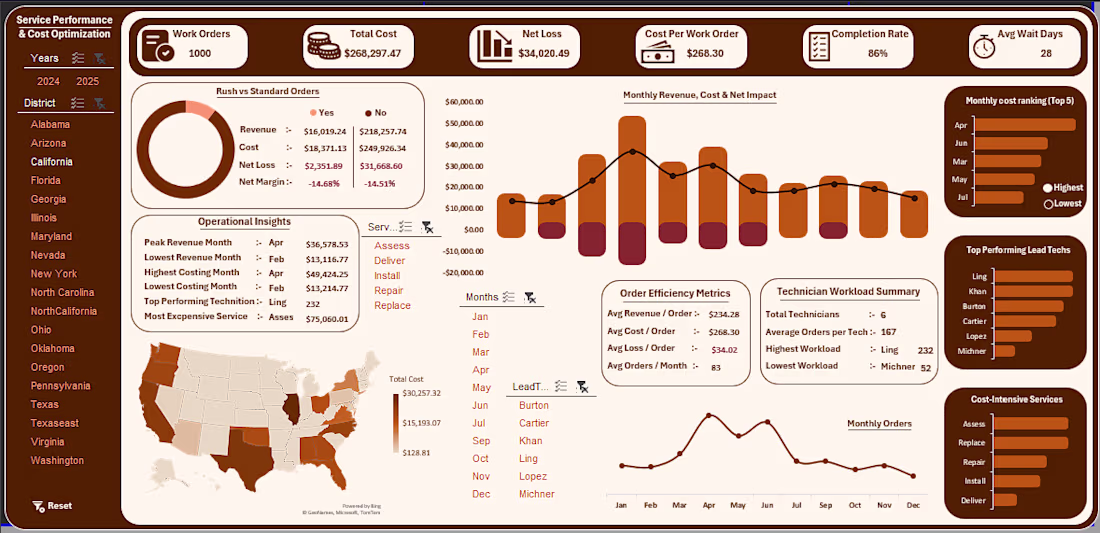

Combining technician workload tracking with geographic performance mapping in one Excel dashboard is really impressive — most service businesses track these separately and miss the connection between regional demand and team capacity. The cost-intensive services breakdown at the...

manually
That's impressive — building a US performance map manually in Excel takes real skill. Most people would reach for Power BI or Tableau for that. Clean execution!

Impressive. Is possible to do something so advanced on Excel only, or there is some code for the dashboard, behind it?
You can do this in power bi and tableau too but you will have to sacrifice some thing you cant use vba or macros or anything similar in power bi to make your dashboard more reactive but they have their benefits too. Though i have never used tableau so cant say anything for that...
Ok, thank you. I didn't know that 😊
The network for creativity
Join 1.25M professional creatives like you
Connect with clients, get discovered, and run your business 100% commission-free
Creatives on Contra have earned over $150M and we are just getting started
Related posts

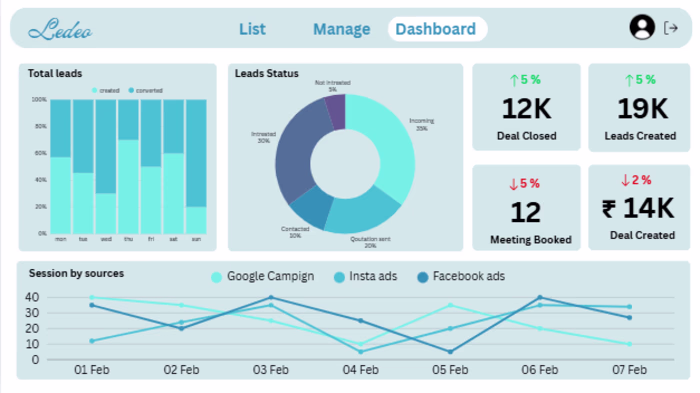
Title:
Lead Management Dashboard — Data Visualization.
Description:
Designed a lead management dashboard to visualize and track key sales metrics including lead status, conversion rates, and session sources. Created a sample dataset and built the dashboard to demonstrate how businesses can monitor their pipeline and make data-driven decisions at a glance.
Tools used:Canva (design), Power BI / Tableau (data visualization experience).


looks great,

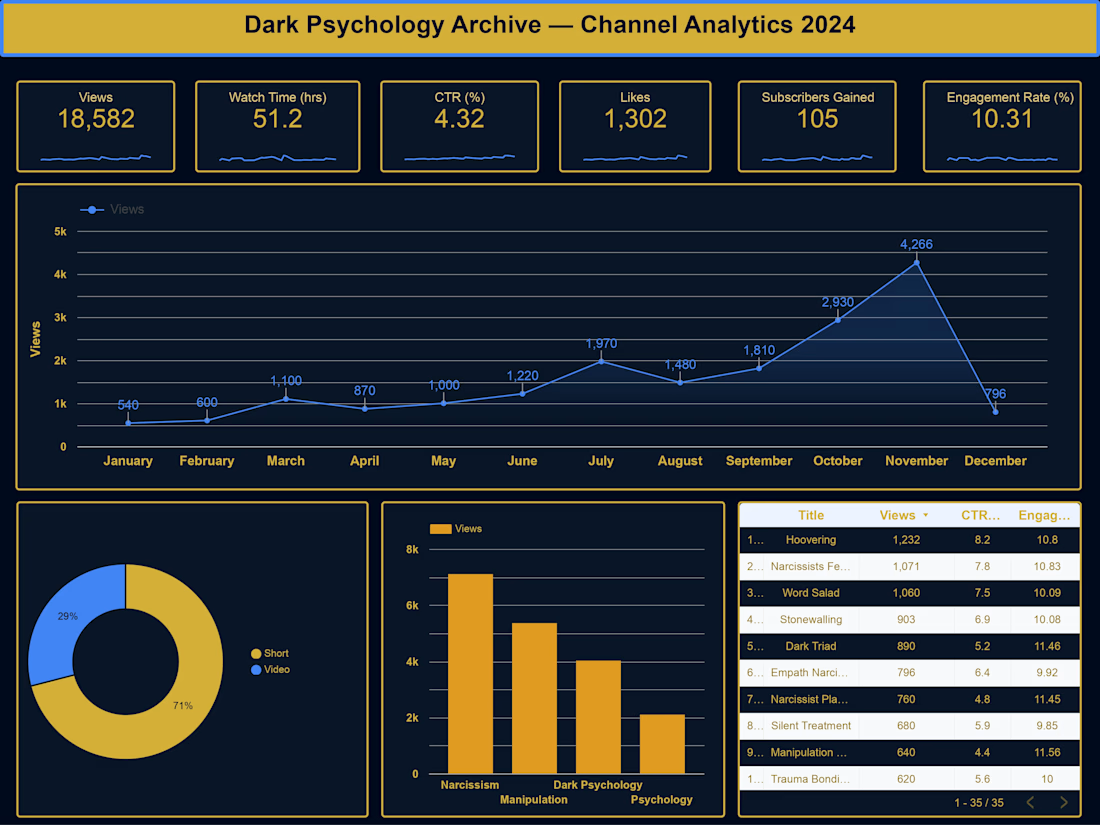
End-to-End Data Analysis: From Raw Data to Actionable Insights


Built a full YouTube analytics dashboard in Google Looker Studio using real channel data from Dark Psychology Archive.
The dashboard tracks 6 KPIs — Views (18,582), Watch Time (51.2 hrs), CTR (4.32%), Likes (1,302), Subscribers Gained (105), and Engagement Rate (10.31%). A monthly trend line reveals the growth curve peaking at 4,266 views in November. Content-type breakdown shows Shorts drive 71% of total views. Top performer: Hoovering at 1,232 views with 8.2% CTR.
Built to help content creators make data-driven decisions on what to post, when, and in what format — without exporting CSVs manually.


Trending


FLORA
Reusable workflows are replacing one-off prompts in creative AI. Share what you're building in FLORA.
portfolioreview
The best portfolios tell a story, not just show a grid. Share yours for feedback.
brandguidelines
Brand guidelines are becoming living systems. What are you building for your clients?
freelancerlife
Freelancer life is wins, pivots, and everything in between. What’s yours right now?
aivideo
AI video tools are moving at warp speed. Which ones are you experimenting with?