The network for creativity
Join 1.25M professional creatives like you
Connect with clients, get discovered, and run your business 100% commission-free
Creatives on Contra have earned over $150M and we are just getting started
Back to feedPost
I built this Excel dashboard to analyze lung disease risk factors and treatment outcomes using healthcare data. The project focuses on identifying patterns between smoking habits, disease risk, and treatment success. Using Pivot Tables, charts, and interactive filters, the dashboard helps visualize key insights and supports better understanding of health trends.
Tools Used: Microsoft Excel, Pivot Tables, Data Cleaning, Data Visualization.
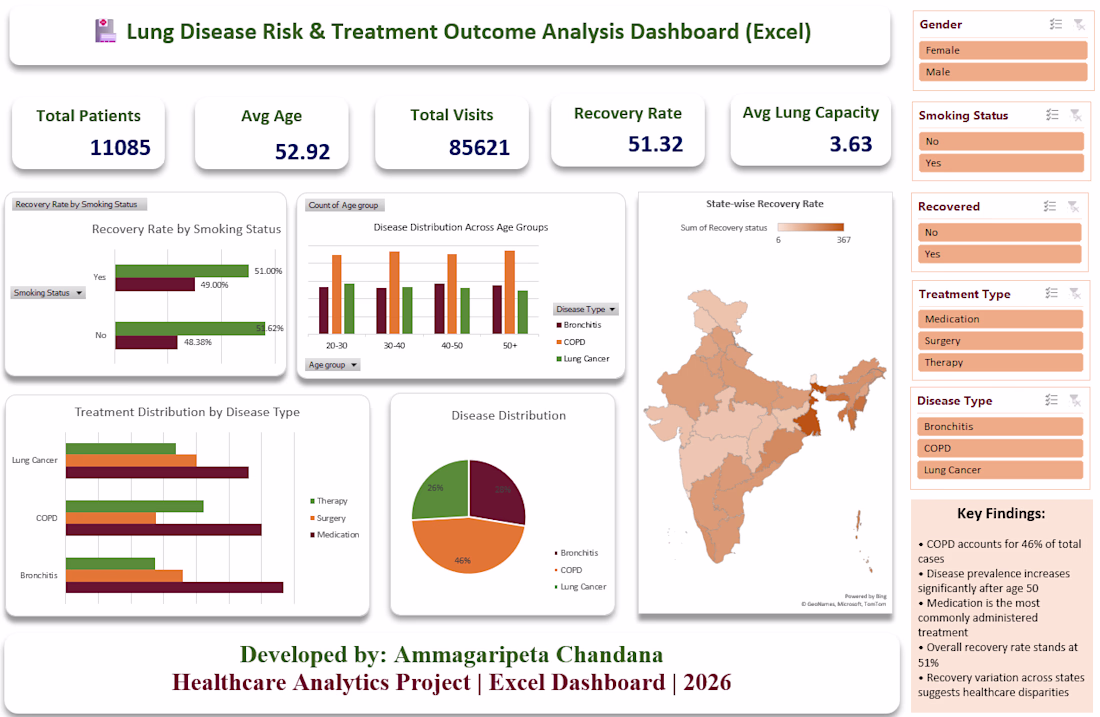
Well structured dashboard. Using Pivot Tables and filters to explore patterns between smoking status and recovery rates is a strong analytical approach.
Thank you, Geethasree! Glad you found the analytical approach useful. It was a great learning experience working on this dashboard.
great work
Thank you, Glad you liked the dashboard.
The network for creativity
Join 1.25M professional creatives like you
Connect with clients, get discovered, and run your business 100% commission-free
Creatives on Contra have earned over $150M and we are just getting started
Related posts
Hey everyone!
I made OVERTIME 🌙 a living map of how the world really sleeps.
The problem / the idea
We celebrate the 5am club. We rarely see the others; the night-shift nurse, the new parent awake at 3am, the insomniac watching the ceiling, and the guard who clocks out at sunrise. I built this for the lyrics inspiration "8 billion people are 8 billion lamps in the night."
What it is
A quiet, generative map of a single day. Each glowing light is one real person's rhythm, when they sleep, move, eat, and how stressed they are. Data visualization is drawn from ~1,200 lives across 9 regions of the world, gathered into one symbolic city. Add your own rhythm and watch your light fly into the crowd. Toggle Weekday vs Weekend and the whole sky shifts. You find your people, you find night owls, early risers, and the sleepless. No scores, no "good" or "bad" sleep. Just where you land, among a thousand others. Whether you sleep late or barely sleep at all, the message is one: you're not alone in the dark, so please take care of yourself. 💛
How I built it (workflow + tools)
Designed in Figma and built entirely in Figma Make. The community isn't random noise; it's a research-calibrated dataset modeled as a mixture of real human archetypes (night owls, night-shift workers, the sleepless, early birds, long sleepers), so the field is genuinely human: people asleep at 6am, people with 3 hours of sleep, people who barely move. A generative particle engine renders every life as its own light, so no two nights look alike.
#ConfigMakeathon · Built with Figma + Figma Make
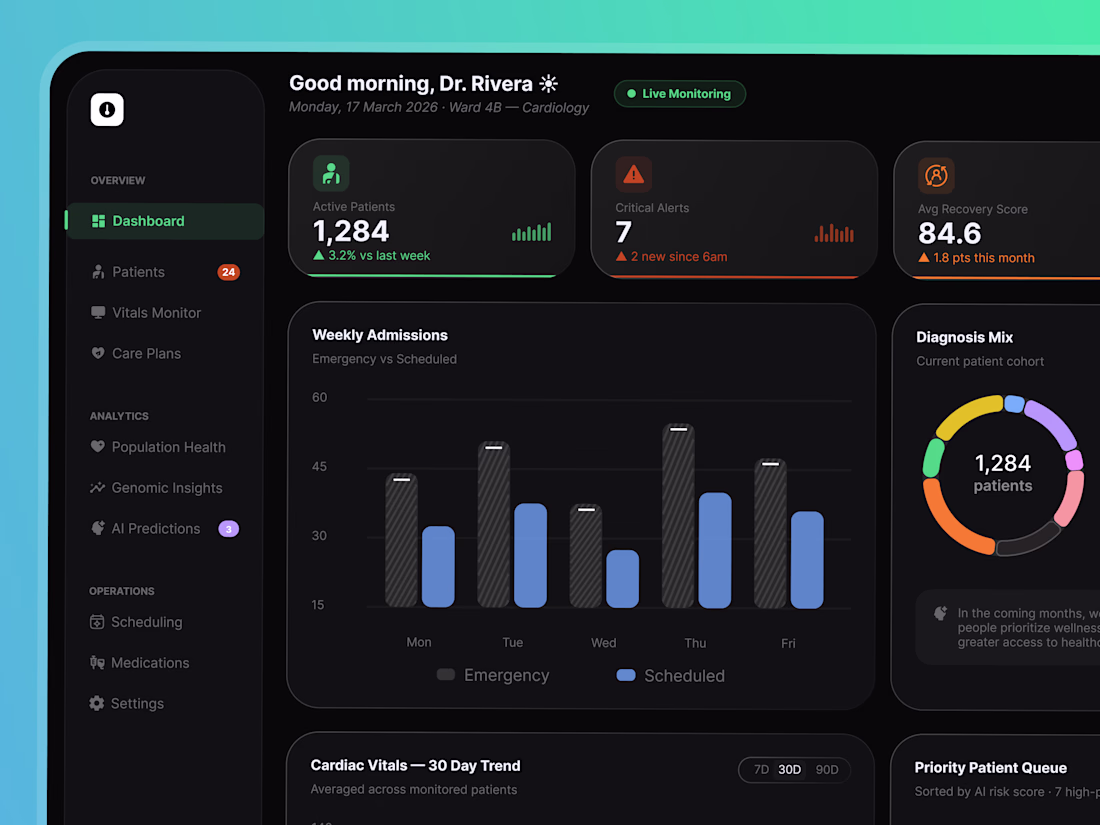
Vitara — AI-Powered Cardiology Dashboard for Healthcare Professionals 🩺
We designed a clean and data-rich dashboard for Vitara — an AI-assisted patient monitoring platform built for cardiologists managing high volumes of patients in real time.
🧩 The design uses a dark, clinical interface that keeps focus on the data: live vitals, AI risk scores, and patient queues are surfaced through clear charts and color-coded status indicators, making critical information instantly scannable during busy ward rounds.
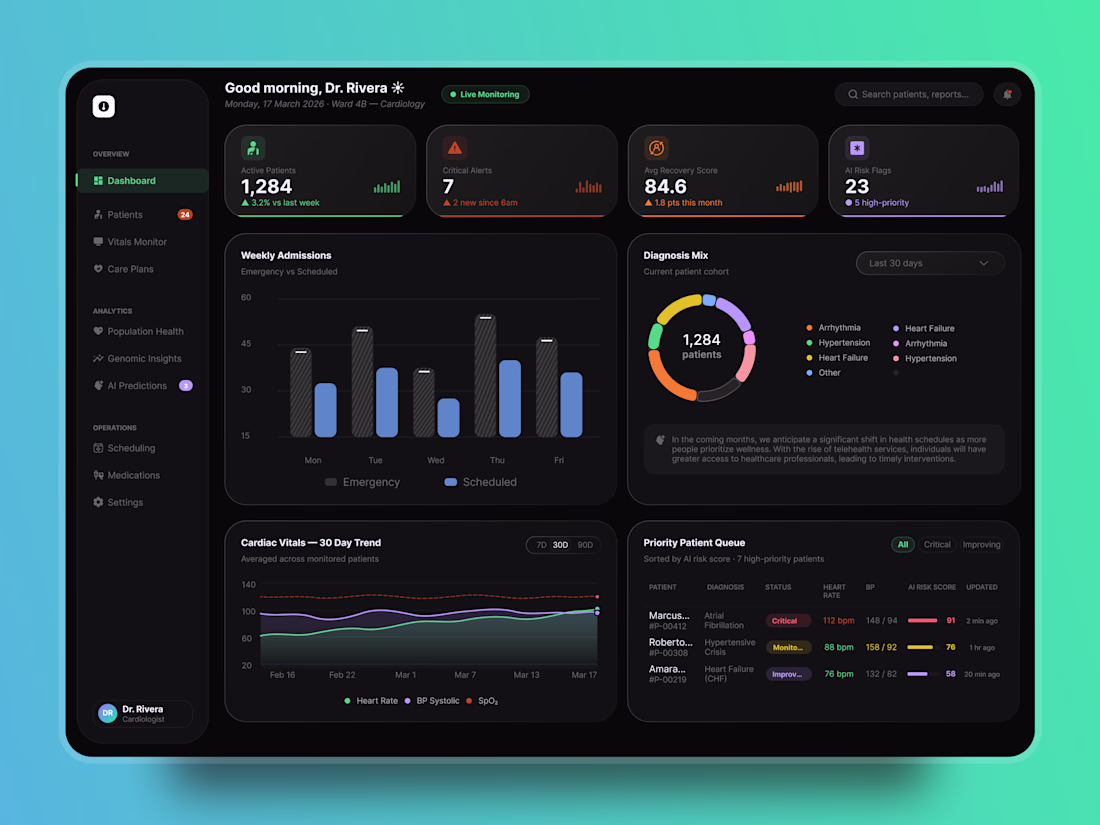
Special attention was given to:
• at-a-glance KPI cards for active patients, critical alerts, and recovery scores;
• weekly admissions and 30-day cardiac vitals trend charts;
• AI-driven diagnosis mix breakdown and priority patient queue with risk scoring;
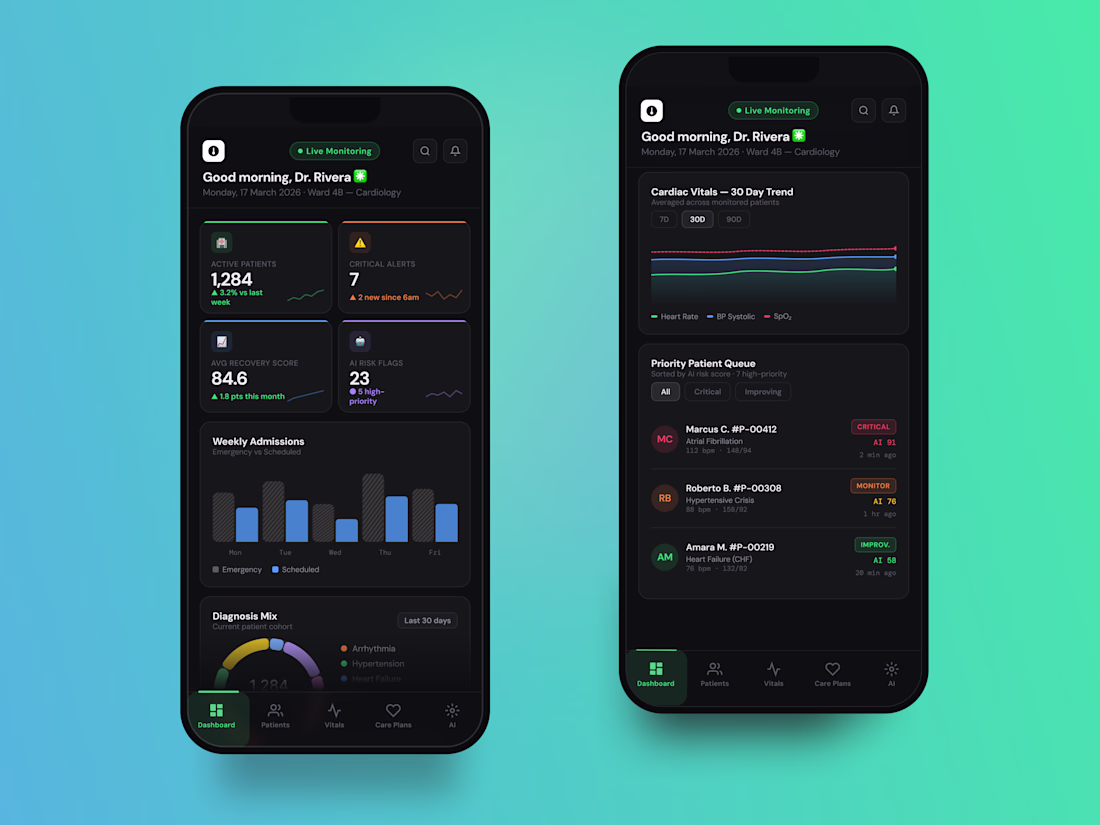
• fully responsive mobile dashboard with bottom navigation for on-the-go access;
• consistent dark UI system optimised for long monitoring sessions.
A precise and trustworthy digital experience that helps medical teams cut through data noise and act on what matters most — designed to support faster, smarter clinical decisions.
Looking to design a data-heavy dashboard that's both powerful and easy to read? Let's build something impactful together!🙌
🌱 Smart Farming Dashboard, designed to grow results.
-> Real-time field intelligence metrics
-> Optimal planting condition tracker
-> Live sensor monitoring across zones
-> 24-hour weather trend insights
-> AI-powered yield predictions
Clean. Smart. Built for farmers who think ahead. 🚜
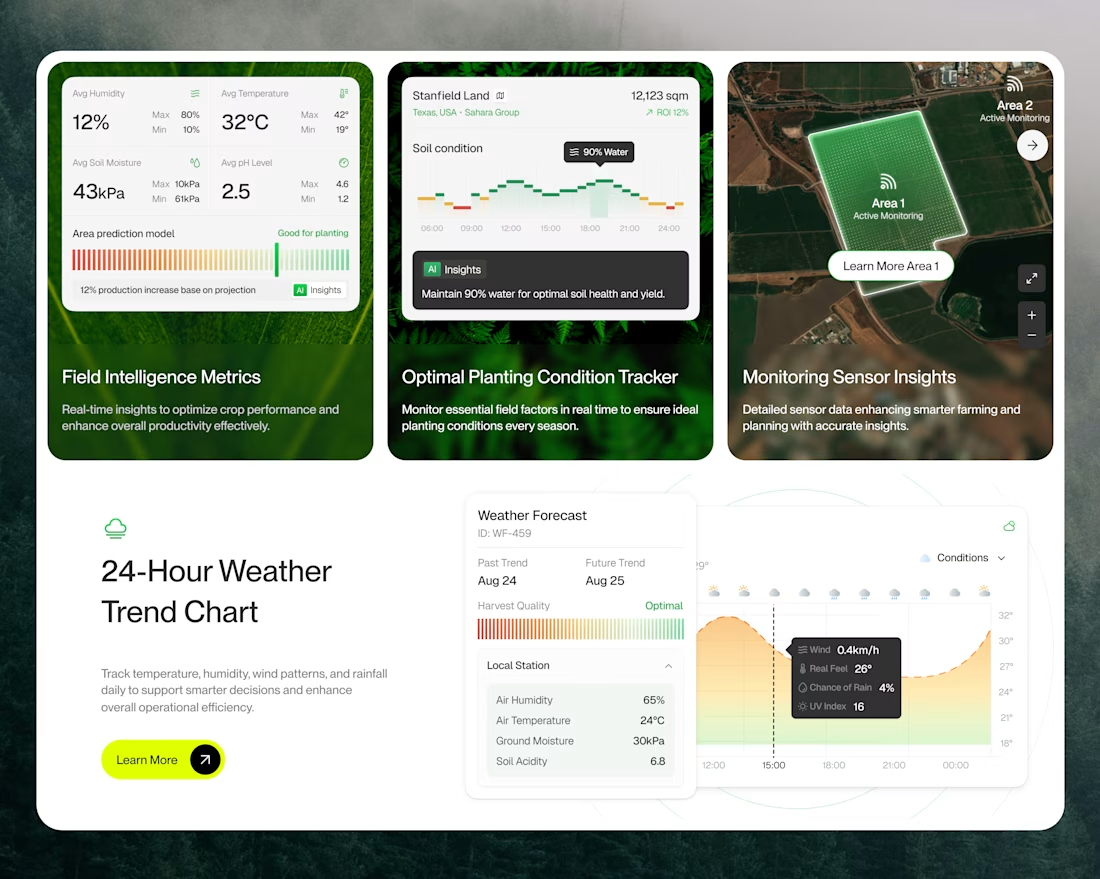
Smart use of data + agriculture.
Trending
Claude
Claude has entered the design space. How are you using Claude Design?
Contra University
Learn from expert creatives how to earn more using next-gen AI tools.
MagicPath
The canvas is infinite, and exploration is becoming the workflow. How are you using MagicPath?
creativeaiflow
Creative AI workflows are evolving. What tools do you use, and what are their strengths and weaknesses?
freelancerlife
Freelancer life is wins, pivots, and everything in between. What’s yours right now?