
chandana A
Data Analyst turning data into business insights
New to Contra
chandana is ready for their next project!

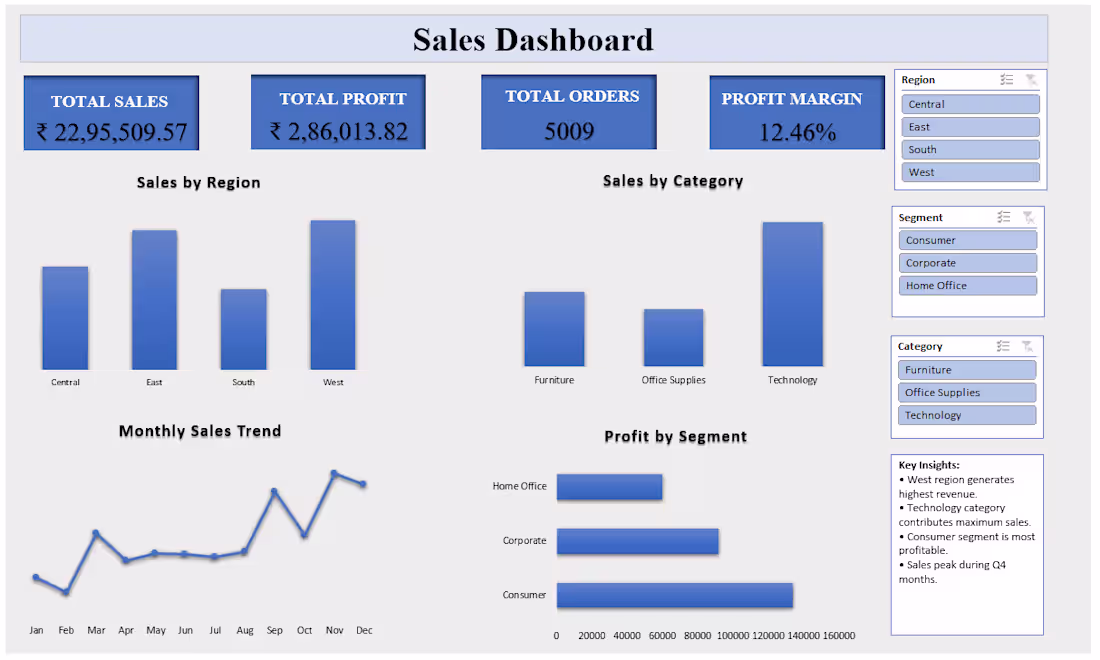
This project presents an interactive Sales Performance Dashboard built using Microsoft Excel. The dashboard analyzes key business metrics such as total sales, profit, profit margin, customer segments, and monthly sales trends.
The objective of this project is to transform raw transactional data into meaningful business insights using Excel’s analytical tools, enabling better understanding of sales performance across regions, categories, and customer segments.
0
26
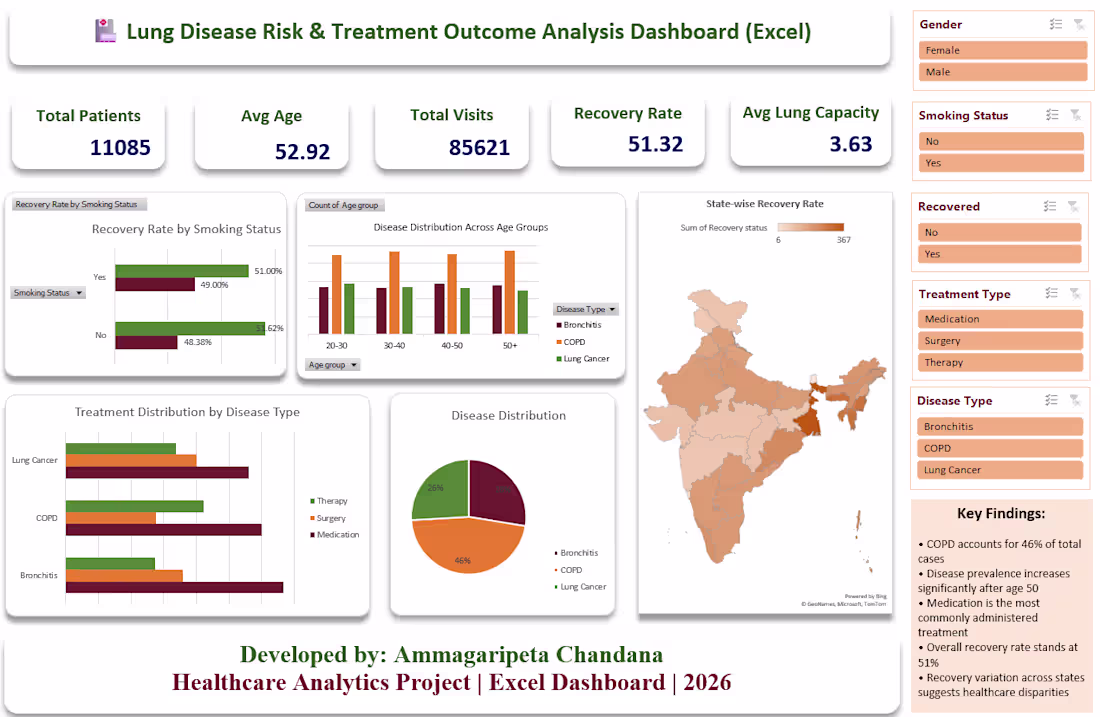
I built this Excel dashboard to analyze lung disease risk factors and treatment outcomes using healthcare data. The project focuses on identifying patterns between smoking habits, disease risk, and treatment success. Using Pivot Tables, charts, and interactive filters, the dashboard helps visualize key insights and supports better understanding of health trends.
Tools Used: Microsoft Excel, Pivot Tables, Data Cleaning, Data Visualization.
4
4
95
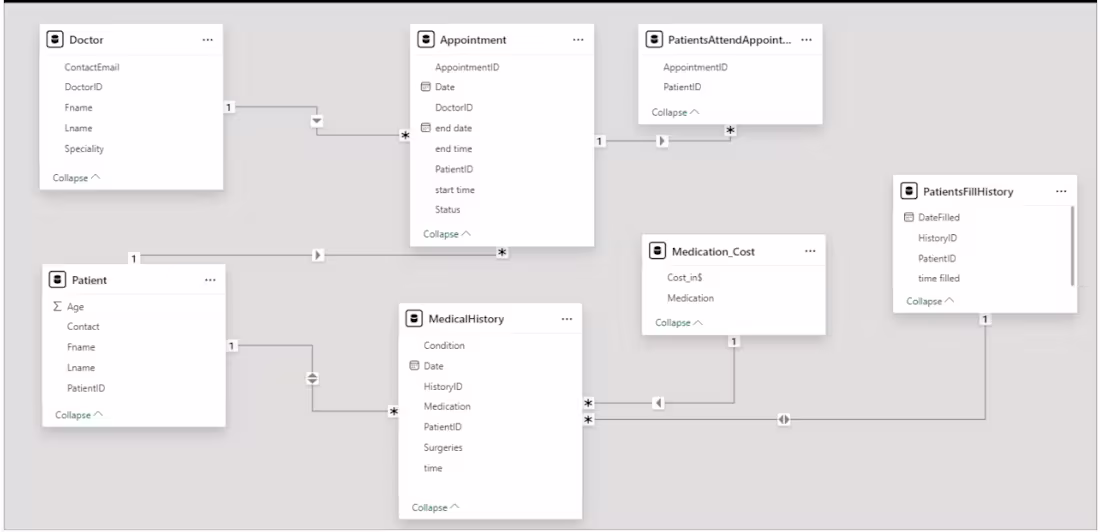
I developed a Hospital Management System using SQL to efficiently manage hospital operations such as patient records, doctor details, appointments, treatments, and billing. The system uses a well-structured relational database with multiple tables, queries, and stored procedures to ensure accurate data management and easy retrieval of hospital information.
Tools Used: SQL, Database Design, Data Management.
0
34
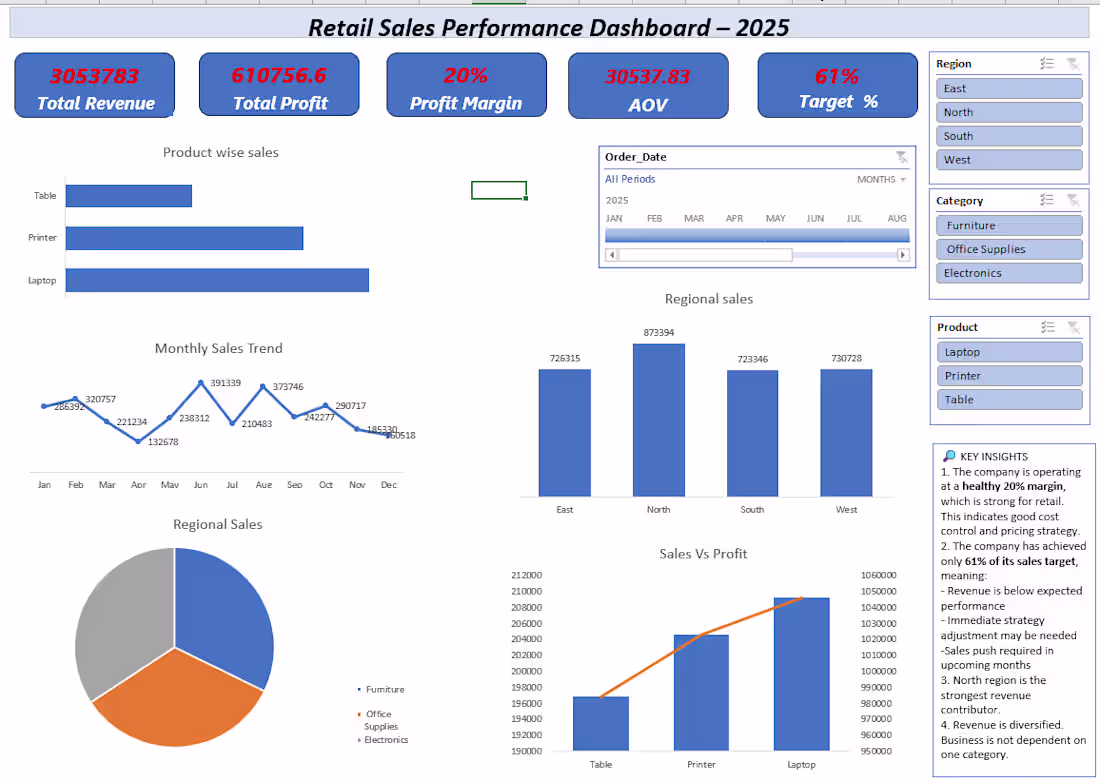
I created this Retail Sales Performance Dashboard using Microsoft Excel to analyze sales, profit, and regional performance. The dashboard includes key KPIs such as Total Revenue, Profit Margin, and Average Order Value, along with interactive filters for region, category, and product. It helps businesses quickly identify trends, compare performance, and make data-driven decisions.
Tools Used: Microsoft Excel, Pivot Tables, Pivot Charts, Slicers, Data Visualization.
1
41