The network for creativity
Join 1.25M professional creatives like you
Connect with clients, get discovered, and run your business 100% commission-free
Creatives on Contra have earned over $150M and we are just getting started
Back to feedPost
🚗 Driver Insights Dashboard
Power BI | Data Analytics | Ride-Hailing Industry
Project Overview
A client in the ride-hailing space had 76M in revenue and 148K+ bookings — but zero visibility into WHY rides were failing. No one could explain the cancellations, the incomplete trips, or the growing gap between driver and customer satisfaction.
I built a 5-page interactive Power BI dashboard that answered all of it.
The Problem
The client's data had serious blind spots:
→ Thousands of cancelled rides with no breakdown of fault
→ Auto & Go Mini vehicles had the highest incomplete ride rate (2.3K and 1.8K)
→ Driver ratings (4.23 avg) consistently below customer ratings (4.41) across all 7 vehicle types — with no system to catch it
→ Seasonal revenue dips (Q1 → Q2) were going unnoticed and unplanned
→ Go Sedan held 24.92% of total booking value — but had no dedicated tracking
What I Delivered
📊 5-page Power BI Dashboard with full interactivity
Overview — Revenue, Booking Ratio, CR by Customer & Driver at a glance
Booking Ratio — VTAT trends across all vehicle types
Revenue by Time — Month-wise & quarter-wise booking price analysis
Cancelling — Cancelled rides breakdown by vehicle type & reason
Cancelling Rides — Incomplete ride root causes + booking value vs distance scatter plot
Plus: Dynamic slicers for Booking Status and Vehicle Type — so the client's team could self-serve their own filters without needing a data analyst every time.
Results & Impact
✅ Operations team can now flag high-cancellation drivers proactively
✅ Vehicle maintenance triggers identified through incomplete ride spikes
✅ CX team has exact cancellation reasons — wrong address, AC issues, driver-asked-to-cancel — with counts, not guesses
✅ Revenue seasonality now visible and plannable quarter by quarter
✅ Fleet resource allocation backed by data (Go Sedan priority confirmed)
Tools Used
• Power BI Desktop
• DAX (custom measures & KPIs)
• Power Query (data cleaning & transformation)
Looking for similar work?
If you have messy data and need a dashboard that actually tells a story — let's talk. I specialize in turning raw operational data into clear, decision-ready visuals.
The network for creativity
Join 1.25M professional creatives like you
Connect with clients, get discovered, and run your business 100% commission-free
Creatives on Contra have earned over $150M and we are just getting started
Related posts
Managing logistics operations without clear insights can lead to delays, inefficiencies, and lost revenue. This dashboard is built to give you complete visibility into your transportation performance — all in one place.
A powerful analytics solution that helps you track bookings, delivery performance, delays, and operational efficiency in real time. Designed for clarity and speed, so you can make decisions without digging through raw data.
🔹Monitor on-time vs delayed deliveries instantly
🔹Track booking trends and operational workload over time
🔹Analyze trip efficiency with lead time and distance metrics
🔹Identify peak hours and demand patterns
🔹Evaluate top drivers and most frequent routes/destinations
🔹Compare weekday vs weekend performance
If you want a clean, professional dashboard that turns your logistics data into real operational insights, I can build a custom solution tailored to your business needs.
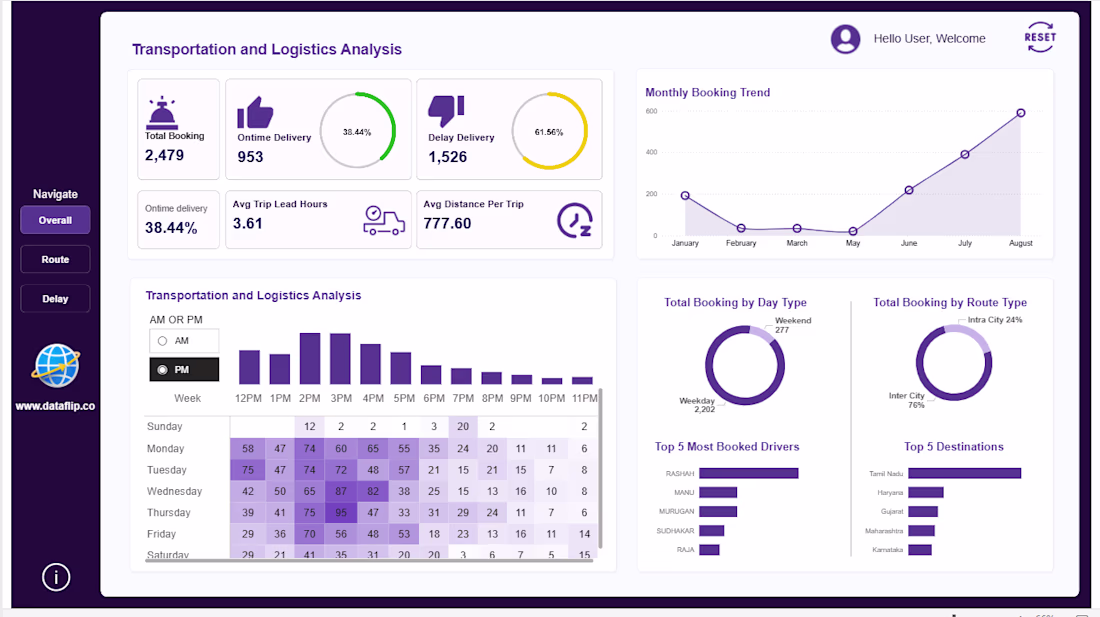
The PM peak hour heatmap by day is the most actionable view here — you can see Wednesday 3PM spiking immediately without digging through any data. That kind of instant pattern recognition is exactly what operations managers need to plan driver allocation. What industry was this built for?
Sales Performance Dashboard
Built this dashboard to turn sales reporting into a clearer management view instead of scattered numbers across separate reports.
The goal was to bring the main performance story into one place through:
- KPI cards for Sales, Profit, Volume, and Dues
- channel contribution analysis
- brand performance breakdown
- customer segment performance
- geographic sales view
- monthly sales and profit trend tracking
What I like most in this type of dashboard is not only the visual side, but the ability to make performance easier to read, compare, and discuss.
A sales dashboard should not just show results. It should help explain where performance is coming from, which segments are driving it, and where attention is needed next.
great idea, breaking down the operation expenses
Trending
Claude
Claude has entered the design space. How are you using Claude Design?
Contra University
Learn from expert creatives how to earn more using next-gen AI tools.
creativeaiflow
Creative AI workflows are evolving. What tools do you use, and what are their strengths and weaknesses?
portfolioreview
The best portfolios tell a story, not just show a grid. Share yours for feedback.
freelancerlife
Freelancer life is wins, pivots, and everything in between. What’s yours right now?