The network for creativity
Join 1.25M professional creatives like you
Connect with clients, get discovered, and run your business 100% commission-free
Creatives on Contra have earned over $150M and we are just getting started
Back to feedPost
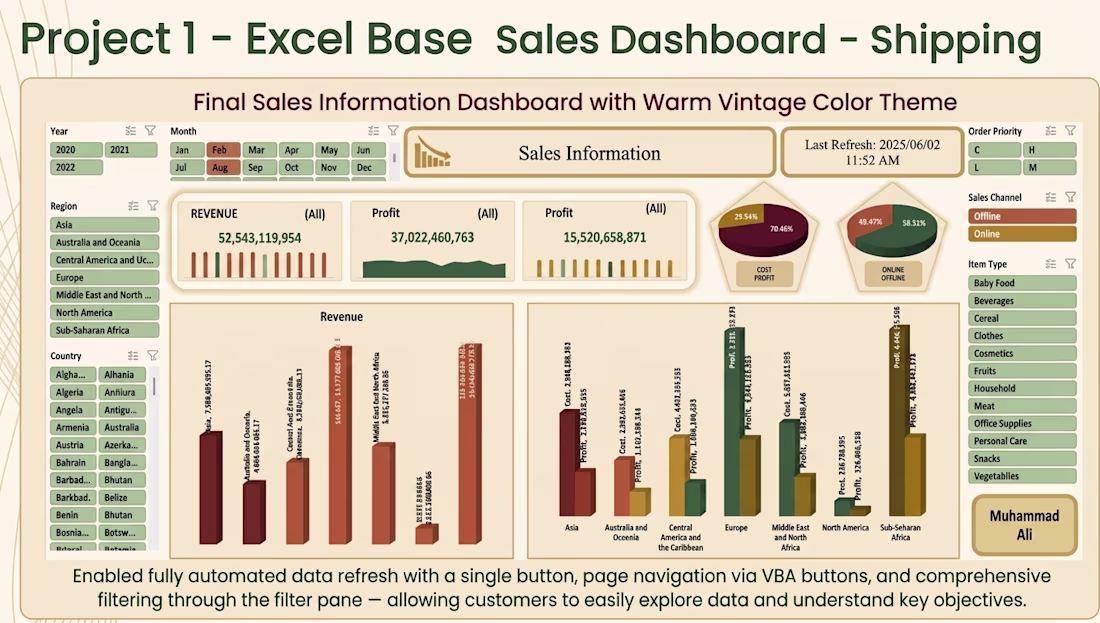
Interactive Sales Dashboard | Excel BI with Dynamic Filters & VBA
Hi, I'm Muhammad Ali.
I built this Excel dashboard because I saw too many business owners drowning in spreadsheets — rows and rows of data, but no clear answers.
So I created something different.
📊 What This Dashboard Does
It takes raw shipping/sales data and turns it into a simple, interactive dashboard. Click a button. Filter by year, region, or product. Instantly see your revenue, profit, and margins.
No complicated software. No coding. Just Excel.
🔍 What You Can Do With It
Filter by Year (2020, 2021, 2022), Month, Region, or Country
Get real-time updates on total revenue and profit.
Quickly check the margin %
Separate performance into 12 or more product categories, such as baby food, drinks, clothes, and so on.
Compare sales channels that are online and offline
Sort by Order Priority (C, H, L, or M)
⚙️ What Makes It Unique
One-click data refresh: update everything with just one click
VBA-powered navigation — move between pages easily
Pivot tables with slicers — instant filtering, no formula errors
Clean, warm-vintage color theme—comfortable for all-day use
Last refresh timestamp — so you always know your data is current
📈 Real Insights You Can Get
Total Revenue: $52.5B+
Overall Profit Margin: ~29.5%
Which regions are performing best?
Which product categories drive the most profit?
How do online and offline sales compare?
📎 What You'll Receive
Fully editable Excel file (.xlsx or .xlsm)
Simple PDF guide (how to use the dashboard, how to refresh data)
💼 Who Is This For?
Business owners who want to understand their sales without hiring a data team
Operations managers who need fast answers
Anyone tired of messy spreadsheets
👨💻 Built by me, Muhammad Ali
I focus on making data useful — not just pretty. If you need a custom dashboard for your business, I'd love to help.
📬 Message me on Contra to get started.


This is clean and very well executed. You made it look effortless, which usually means a lot of work happened behind the scenes. Can you walk us through how you approached it from start to finish?

@kolawole Mordecai — thank you.
My process:
1: Understand the business need
2: Clean & model data in Power Query
3: Write DAX measures (Revenue, Profit, Margin)
4: Build simple, clear visuals
5: Add VBA buttons + filter pane for interactivity
6: Set up one-click data refresh
7: Test...
The network for creativity
Join 1.25M professional creatives like you
Connect with clients, get discovered, and run your business 100% commission-free
Creatives on Contra have earned over $150M and we are just getting started
Related posts

Transform Your Data into Actionable Insights 📊
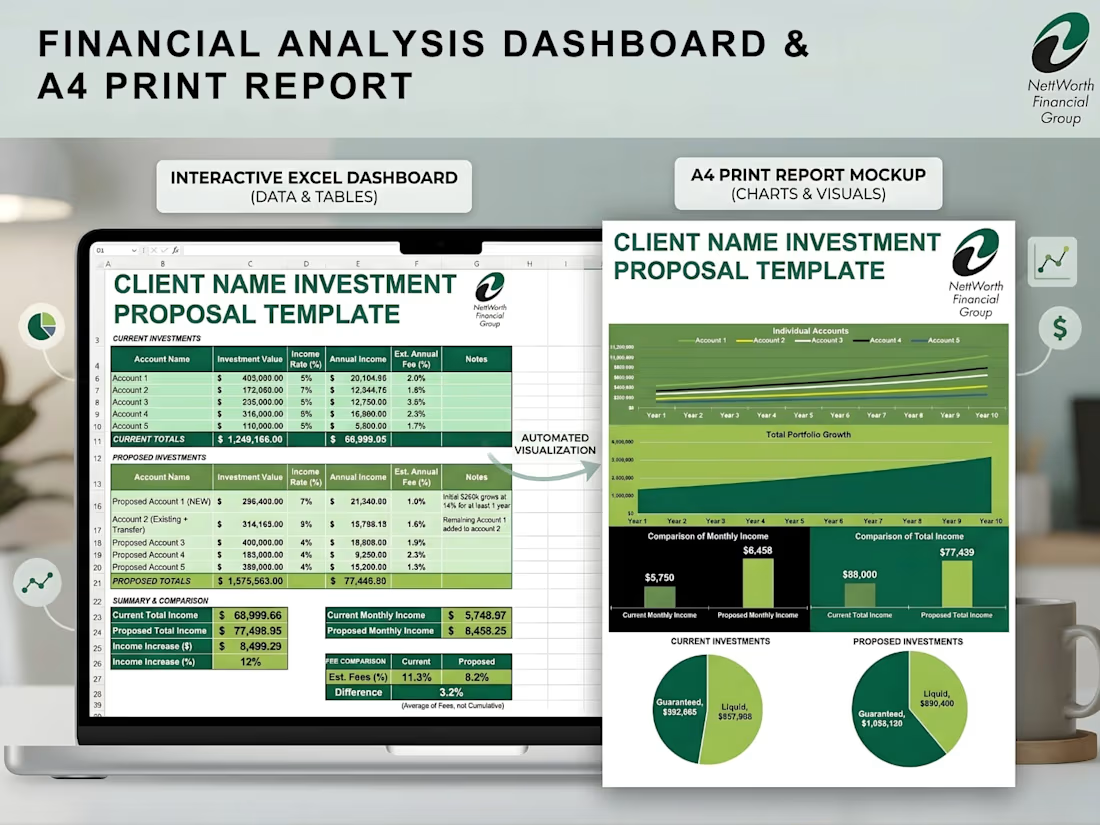
Stop settling for messy spreadsheets. I specialize in building custom, interactive dashboards that not only track your key metrics in real-time but also seamlessly translate into stunning, presentation-ready PDF reports.
Whether you need to monitor daily operations or pitch a financial proposal to a high-ticket client, I bridge the gap between raw data and professional design.
🛠️ What I Built:
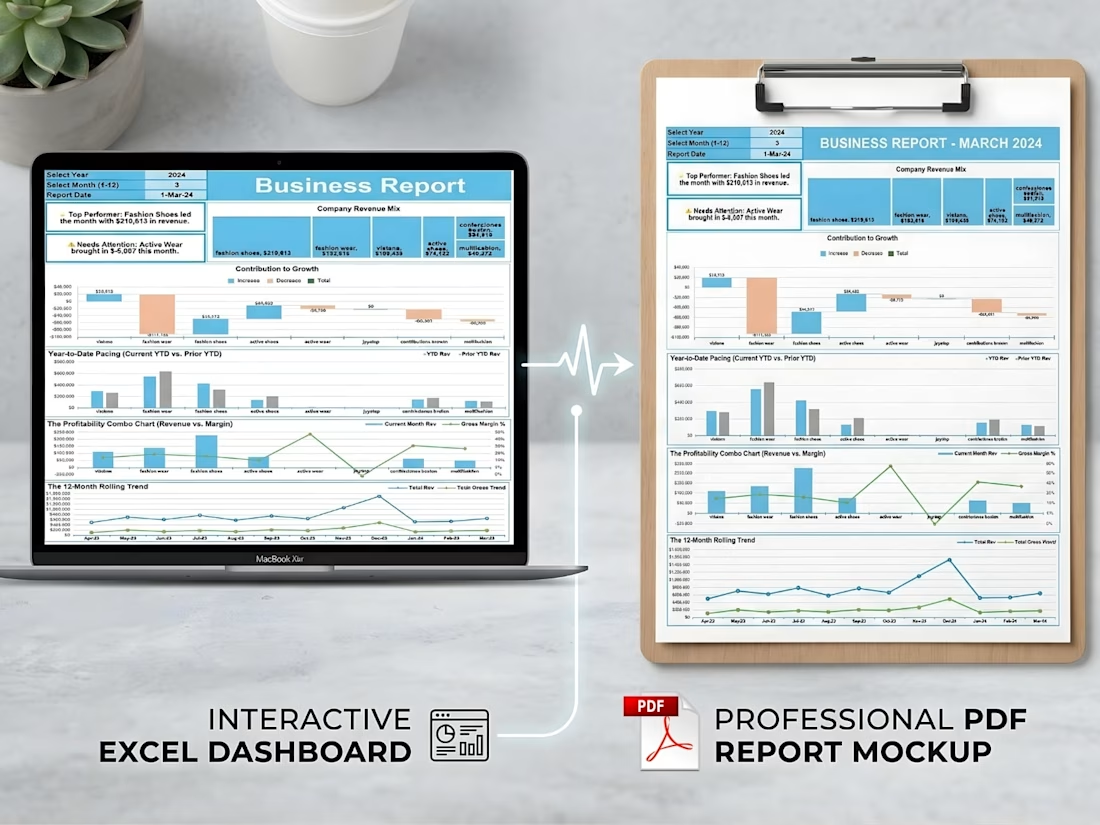
Business & Revenue Reports: Track YTD pacing, profitability margins, and 12-month rolling trends with clear visual hierarchies.
Financial Investment Proposals: Automated systems that turn standard data entry into comprehensive, highly visual portfolio growth projections.
Modern Lead Trackers (Google Sheets): Keep a pulse on sales rep performance, conversion rates, and pipeline health.
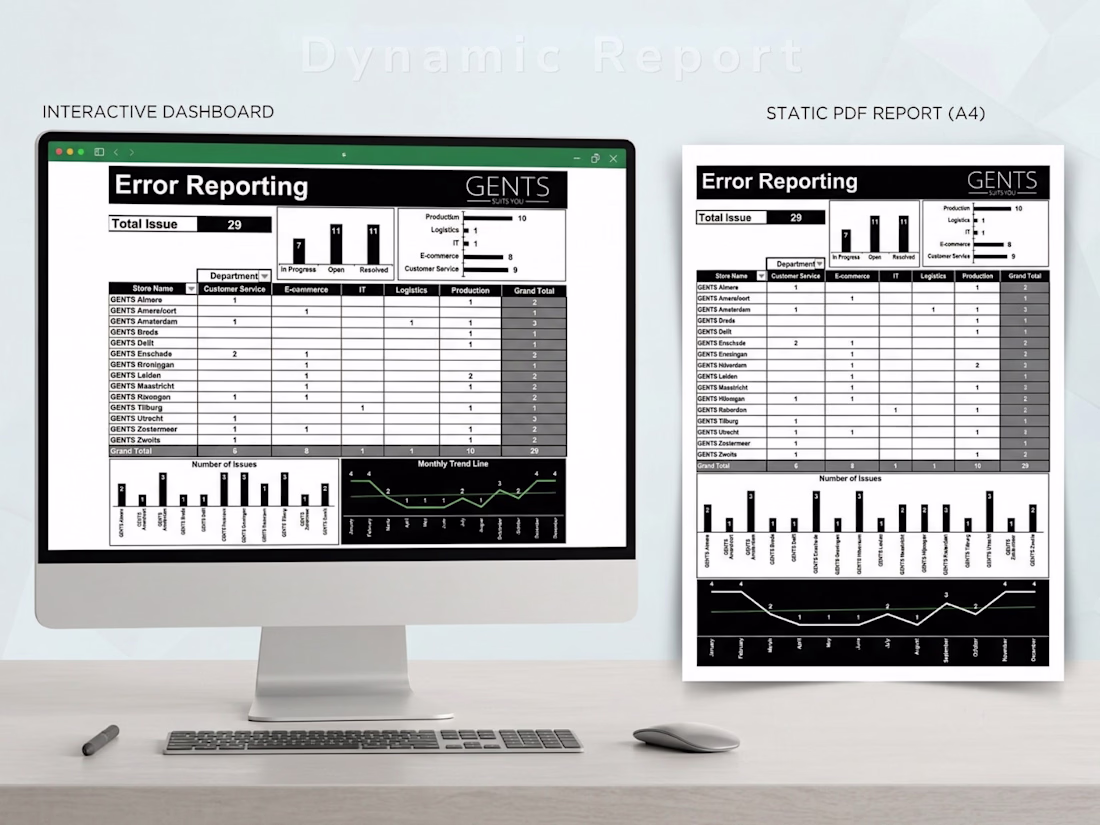
Operational Error Tracking: Dynamic issue-logging systems sorted by department and location to quickly identify bottlenecks.
✨ Key Features of My Dashboards:
Dual-Format Delivery: Fully interactive digital workspaces (Excel/Google Sheets) paired with automated, perfectly formatted A4 PDF print outputs.
Automated Visualizations: Type in your raw data, and watch the charts, graphs, and summary cards update instantly.
Clean UI/UX: Professional, brand-aligned designs that make complex data easy to digest for stakeholders and clients.
Ready to upgrade your reporting and save hours of manual formatting? Let’s collaborate and build a custom data solution tailored to your business needs!
#DataVisualization #ExcelDashboards #GoogleSheets #Reporting #FreelanceDataExpert #BusinessAnalytics


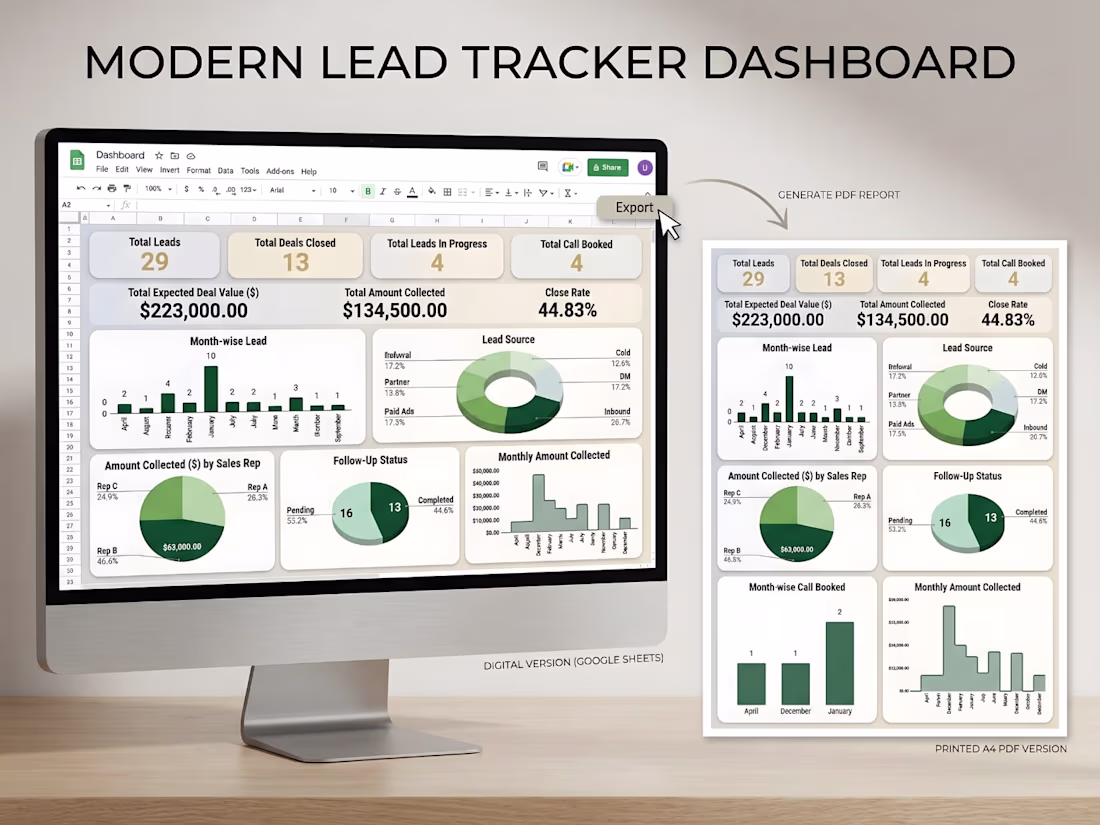

The dual format delivery — interactive Excel plus automated A4 PDF output — is a really smart differentiator. Most clients want something they can both work in and present professionally, and combining both in one system removes a lot of back and forth. The lead tracker with...

Email Marketing Analytics Dashboard – UI/UX Design
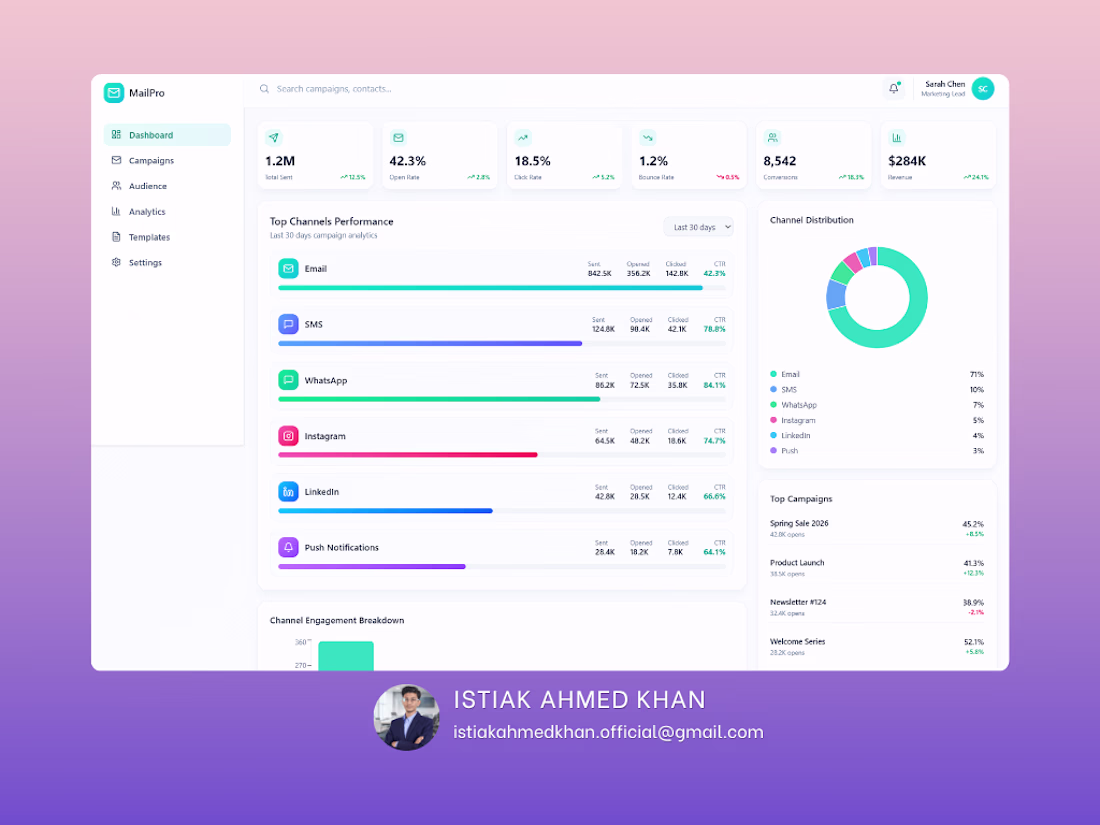
Struggling to track campaign performance across multiple channels? This dashboard is designed to give you a complete, real-time view of your marketing efforts in one clean and intuitive interface.
A powerful, easy-to-use dashboard that helps you monitor email, SMS, social media, and push campaigns without the confusion of scattered data. Every key metric is presented clearly so you can make faster, smarter decisions.
Key Capabilities:
Track open rates, click rates, conversions, and revenue in real time,
Compare performance across multiple marketing channels,
Identify your top-performing campaigns instantly,
Understand audience engagement with clear visual breakdowns,
Spot trends and optimize campaigns quickly.
Most businesses run campaigns but struggle to understand what’s actually working. This dashboard eliminates guesswork by turning your data into clear, actionable insights — helping you improve ROI and scale winning strategies.
Perfect For:
Digital marketers,
E-commerce brands,
Agencies managing multiple campaigns,
Startups looking to optimize growth.
If you want a high-converting, professional dashboard that not only looks great but drives real business decisions — I can help you build it.


Nice work

Sociafy—Social Media Analytics Dashboard
The Problem:
Social media managers juggle between Instagram, TikTok, Facebook, and LinkedIn just to see how things are going. Each platform has its own analytics, its own layout, and its own way of showing numbers. It's a mess.
The Solution:
One dashboard that pulls everything together. You open it and immediately see your total followers, engagement, reach, and impressions. Scroll down and there are charts for audience growth, age breakdown, sentiment analysis, and a comparison table for all your platforms. There's even a heatmap that tells you the best time to post.
What I focused on:
- making it scannable in under 5 seconds
- clear visual hierarchy (big numbers first, details below)
- colorful but not overwhelming
- platform comparison that actually helps you decide where to focus
Tools: Figma
Tags: UI Design, Dashboard, SaaS, Social Media, Product Design
looks really great, how did you make this product demo video


Trending


FLORA
Reusable workflows are replacing one-off prompts in creative AI. Share what you're building in FLORA.

Contra University
Learn from expert creatives how to earn more using next-gen AI tools.
creativeaiflow
Creative AI workflows are evolving. What tools do you use, and what are their strengths and weaknesses?
portfolioreview
The best portfolios tell a story, not just show a grid. Share yours for feedback.
freelancerlife
Freelancer life is wins, pivots, and everything in between. What’s yours right now?