The network for creativity
Join 1.25M professional creatives like you
Connect with clients, get discovered, and run your business 100% commission-free
Creatives on Contra have earned over $150M and we are just getting started
Back to feedPost

This project involved analyzing a sales dataset and building an interactive Excel dashboard to visualize business performance.
The dashboard includes charts showing total revenue by date, revenue by product category, revenue by sales representative, and revenue by region.
The goal of the project was to transform raw sales data into clear visual insights that help businesses track performance and make better decisions.


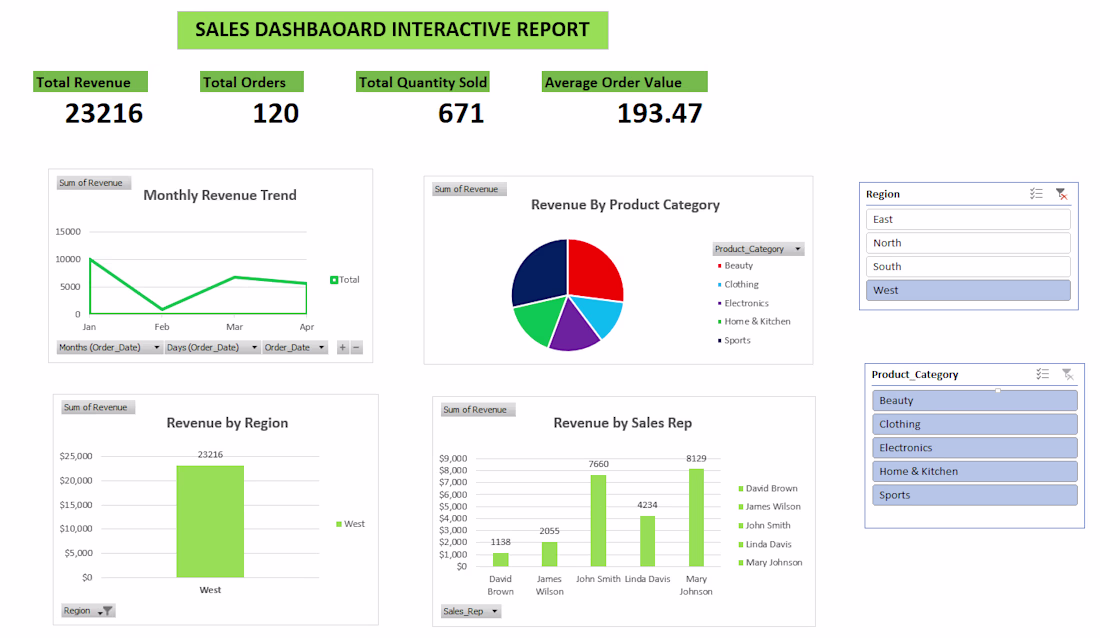

Breaking down revenue by region, category and sales rep in one dashboard gives management exactly what they need without digging through raw data. Clean layout and great use of slicers!
The network for creativity
Join 1.25M professional creatives like you
Connect with clients, get discovered, and run your business 100% commission-free
Creatives on Contra have earned over $150M and we are just getting started
Related posts
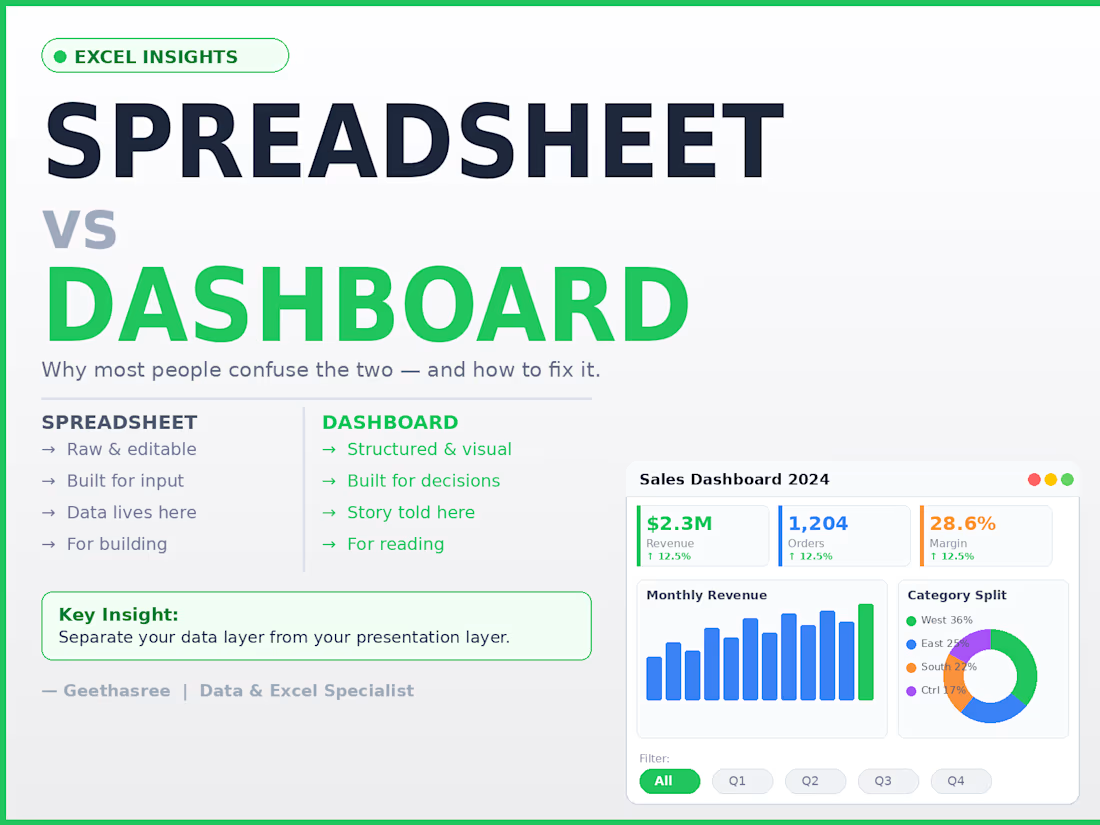
Most people think a spreadsheet and a dashboard are the same thing.
They're not.
A spreadsheet is where data lives.
A dashboard is where decisions happen.
The difference:
Spreadsheet → raw, editable, flexible, built for input
Dashboard → structured, visual, built for reading and decisions
The mistake I see most often:
People try to do both in the same sheet.
The result?
Decision makers see too much raw data
Numbers get accidentally edited
No one knows what to trust
The fix is simple:
Keep your data layer and your presentation layer separate.
Raw data in one sheet. Dashboard in another.
One is for building. One is for reading.
When you separate them, updates become clean, mistakes become rare, and your reports actually get used.
A spreadsheet stores your data.
A dashboard tells its story.
dataanalystvirtualassistantBusiness AnalysisData AnalysisData VisualizationGoogle SheetsMicrosoft Excel


You’re right .


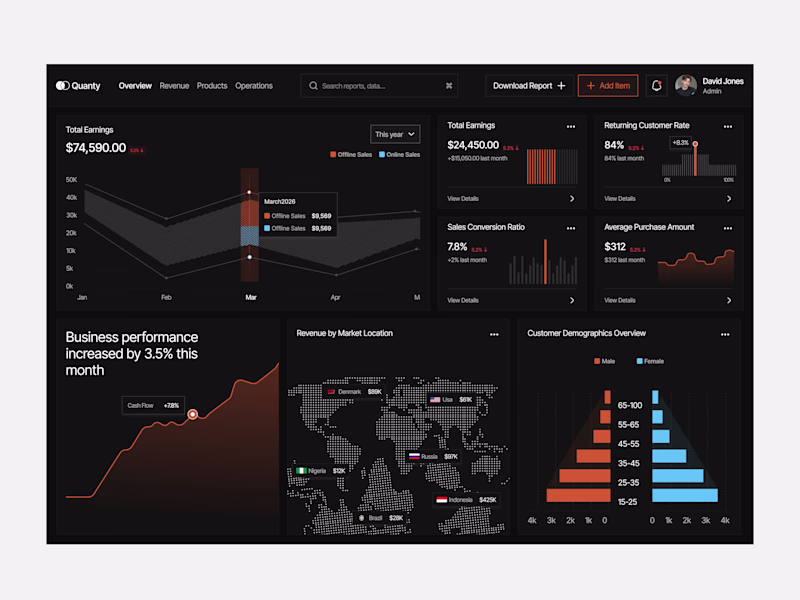
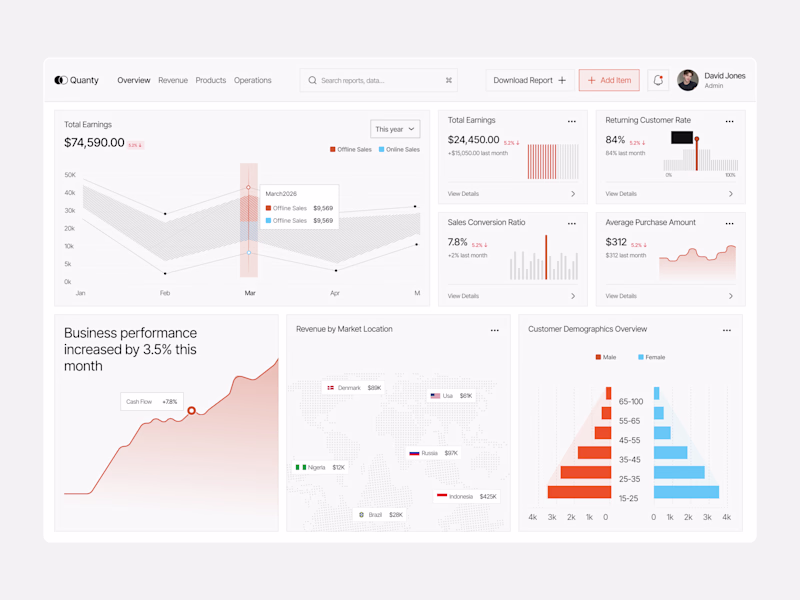

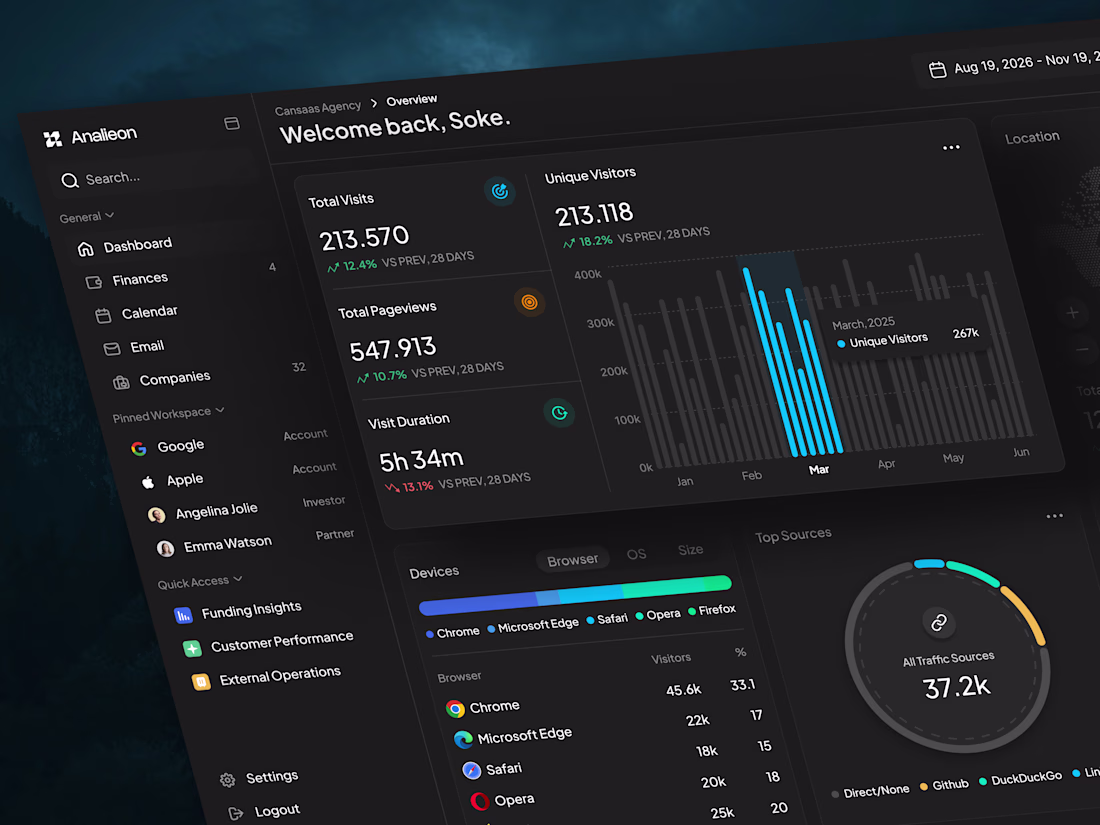
This analytics dashboard concept focuses on simplifying how teams monitor performance, user behavior, and traffic insights in one unified SaaS interface. By combining clean data cards, interactive charts, and visualized traffic sources, the dashboard helps users quickly understand trends, track engagement metrics, and explore analytics without feeling overwhelmed.
📩 Collaborate with Us? Contra Cansaas Agency

top class work


Trending
aivideo
AI video tools are moving at warp speed. Which ones are you experimenting with?
returntonature
Spring is a reset for creativity. What’s inspiring you outside the screen right now?
aidesignflow
AI tools are redefining design work. What's your current workflow?
freelancerlife
Freelancer life is wins, pivots, and everything in between. What’s yours right now?
allthingsmetal
Metal is having a design moment – from chrome to gates and grates. What designs are you forging?