
VICTOR UGBEDEOJO ADAMA
Data Analyst, Excel dashboards, SQL queries, data insights.
New to Contra
VICTOR UGBEDEOJO is building their profile!
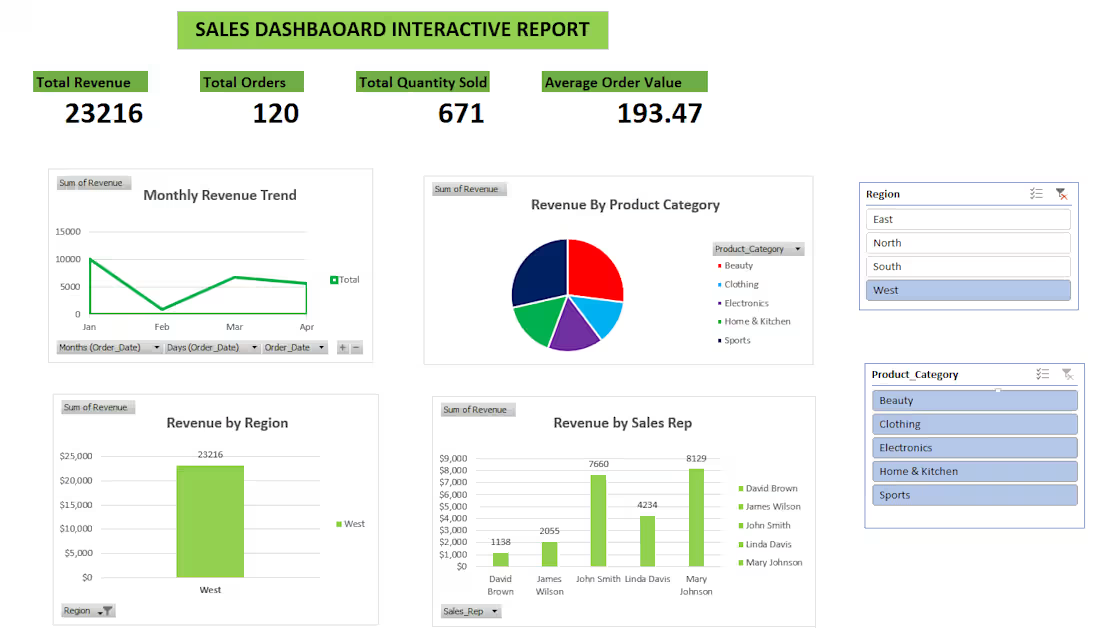
This project involved analyzing a sales dataset and building an interactive Excel dashboard to visualize business performance.
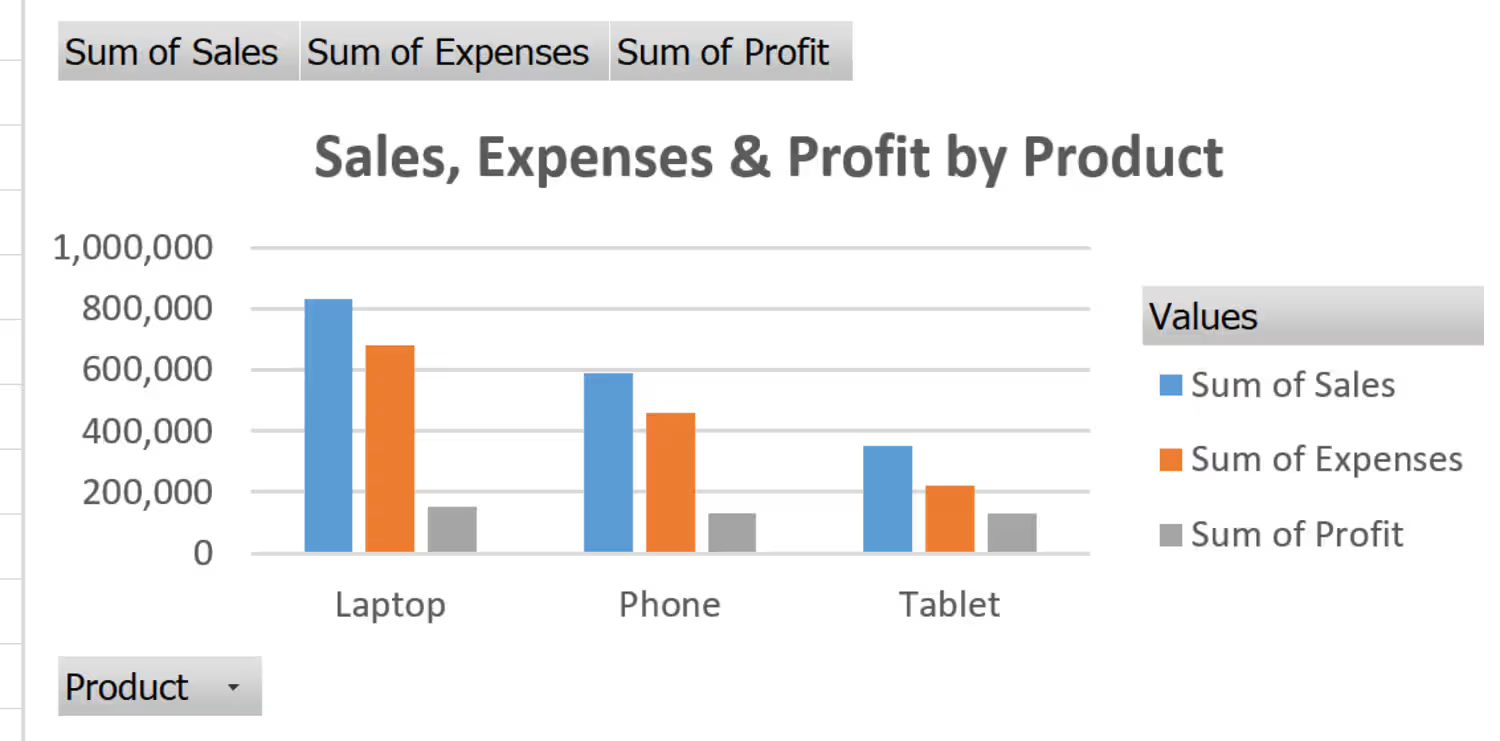
The dashboard includes charts showing total revenue by date, revenue by product category, revenue by sales representative, and revenue by region.
The goal of the project was to transform raw sales data into clear visual insights that help businesses track performance and make better decisions.
1
1
67