The network for creativity
Join 1.25M professional creatives like you
Connect with clients, get discovered, and run your business 100% commission-free
Creatives on Contra have earned over $150M and we are just getting started
Back to feedPost

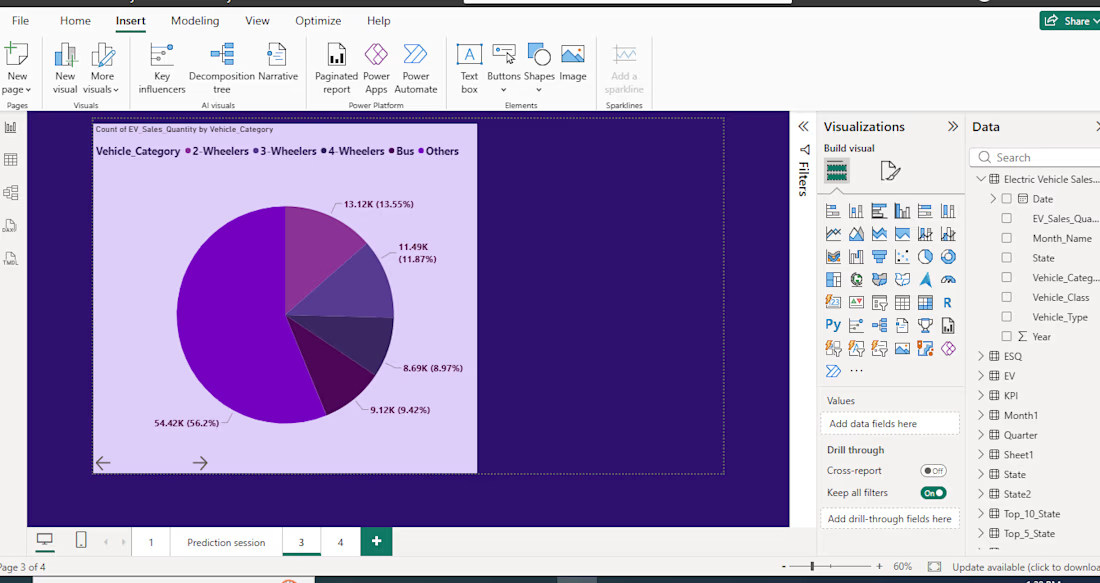
Electric Vehicle Market Share Analysis & Segmentation (Power BI)
Overview:
Designed a visual analytics report in Power BI to analyze Electric Vehicle (EV) sales distribution across different vehicle categories (2-Wheelers, 3-Wheelers, 4-Wheelers, Buses, and Others). This project translates raw sales metrics into categorical market share insights.Key Analysis & Process:Categorical Data Segmentation: Aggregated and grouped raw EV sales quantities by vehicle type to evaluate relative market composition.Proportional Data Visualization: Implemented a custom pie chart visual to display market share percentages and unit distributions clearly at a glance.Data Preparation: Cleaned underlying dataset tables (Vehicle_Category, Vehicle_Class, EV_Sales_Quantity) for accurate aggregation across categories.Outcome:Delivered an intuitive visual summary that highlights category dominance—showing that 2-Wheelers represent the largest market segment ($56.2%$)—allowing stakeholders to quickly identify top revenue drivers and growth opportunities.

The network for creativity
Join 1.25M professional creatives like you
Connect with clients, get discovered, and run your business 100% commission-free
Creatives on Contra have earned over $150M and we are just getting started




Related posts

This is such a great example of turning complex data into a visual experience. 🎾🔥
Love how the court becomes part of the analytics instead of just sitting in the background. Really impressive work!

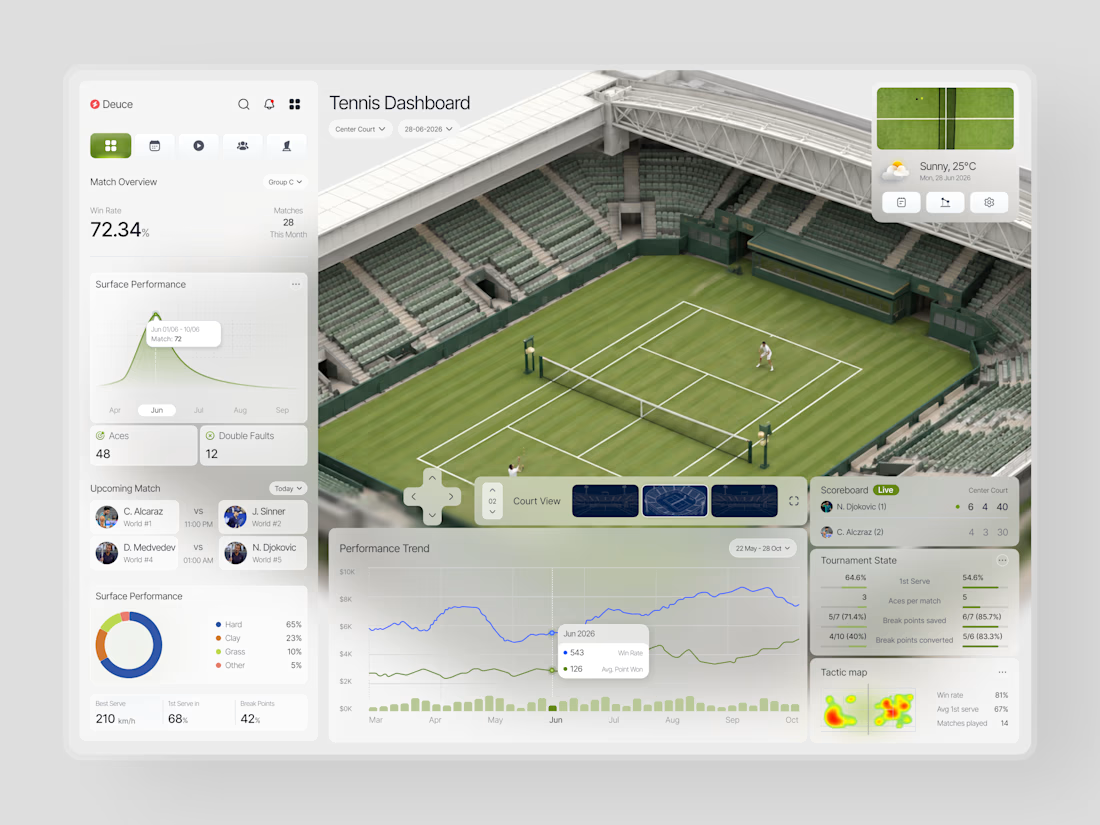
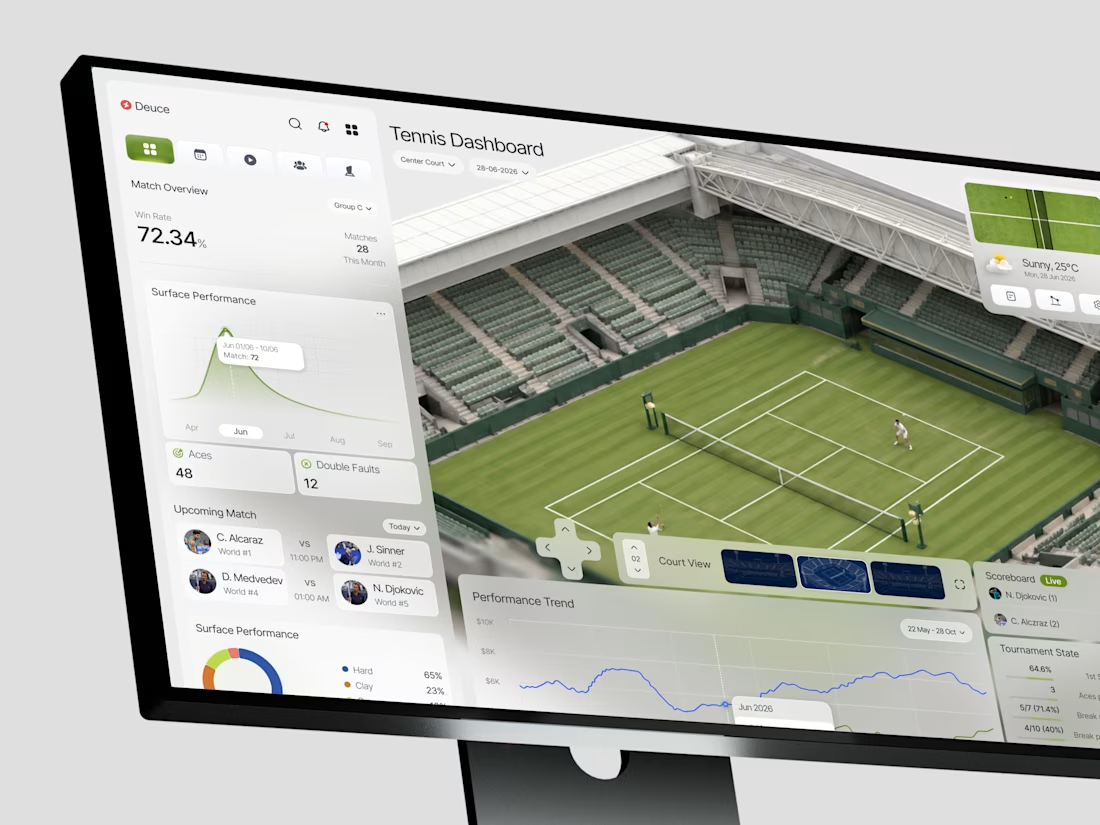
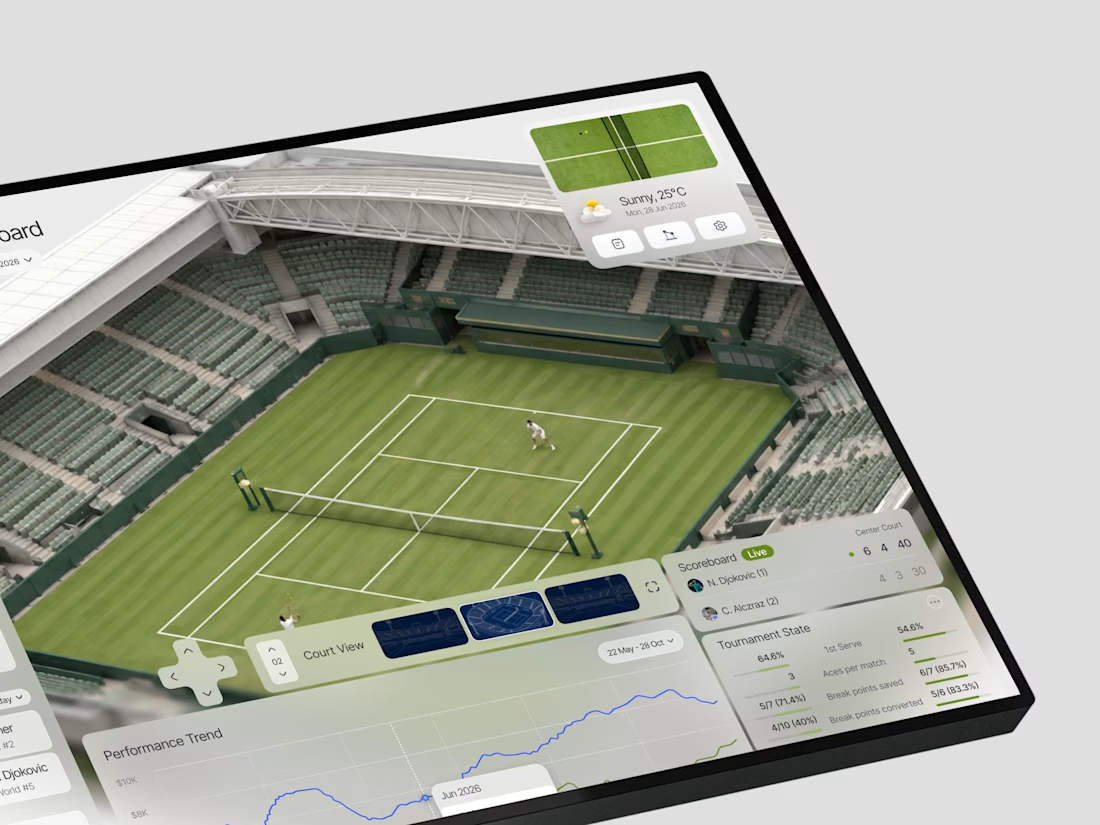
When does a sports dashboard need the court to be more than a background?
In this case, we were designing Deuce a tennis analytics platform that needed to make complex match data feel immediate and spatial, not just numerical.
The brief was clear: analysts and coaches don't just...

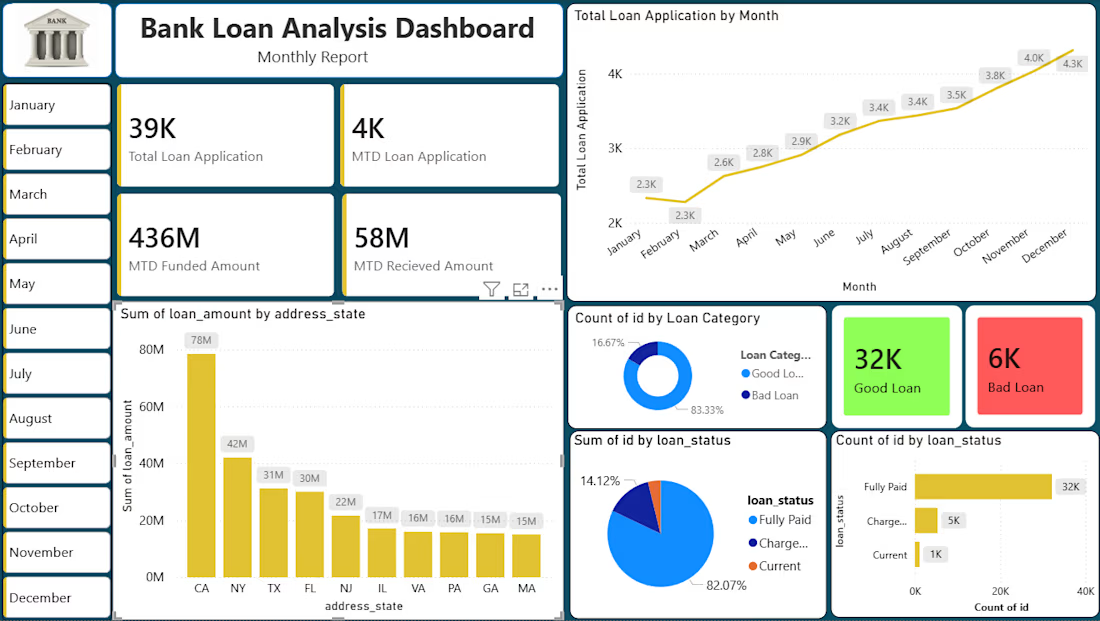
Created an interactive Power BI dashboard to analyze loan applications, funded amounts, loan quality, and borrower trends. Used Power Query and DAX to clean data, create measures, and visualize key insights.

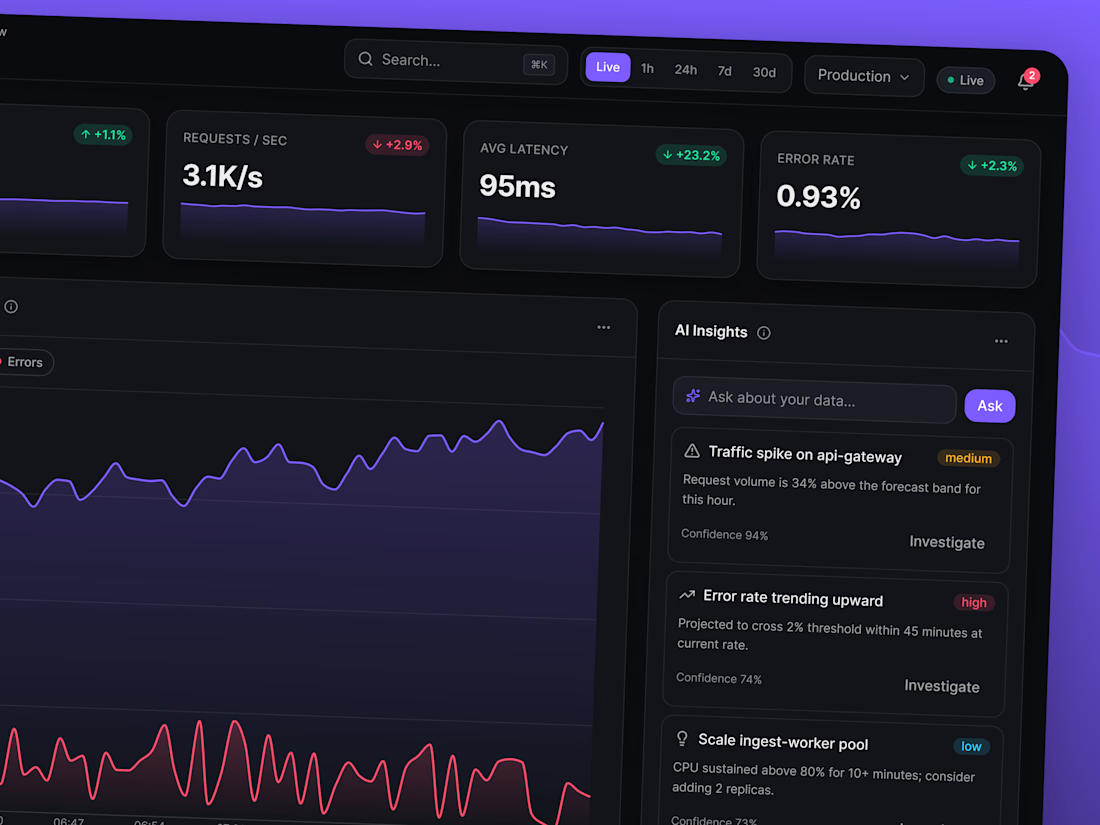
Fluxiom — AI-Powered Analytics Dashboard
A real-time monitoring dashboard that turns raw system metrics into decisions, not noise.
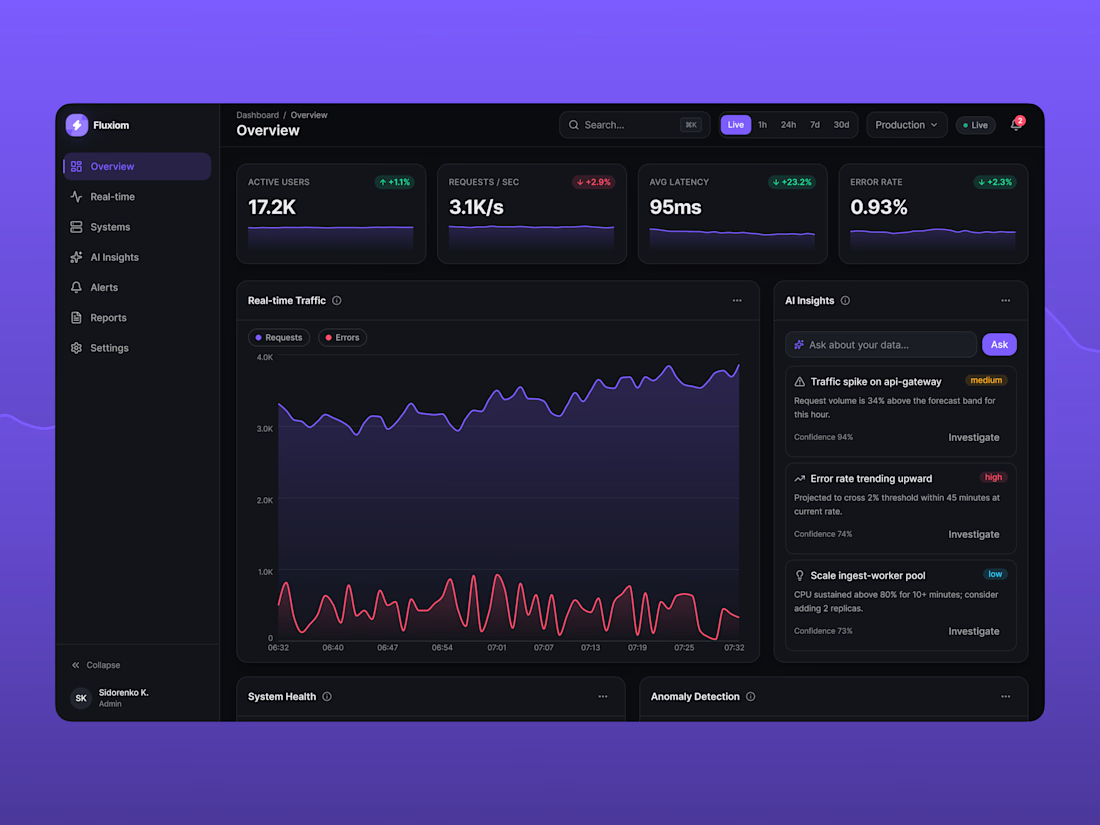
Pulse is a full analytics and observability platform concept designed for engineering and ops teams who need to watch live traffic, infrastructure health, and anomalies without digging through raw logs. It combines real-time data visualization with AI-generated insights, so teams can spot problems before they escalate — not after.
❓The problem
Most internal dashboards are either too sparse (a wall of numbers) or too busy (a wall of charts). Pulse was designed to sit in between: dense enough to be useful at a glance, calm enough to live on a screen all day.
What's inside:
• Live KPI tracking — active users, request rate, latency, and error rate with animated deltas and sparklines
• Real-time traffic visualization — streaming charts that update every second without jank
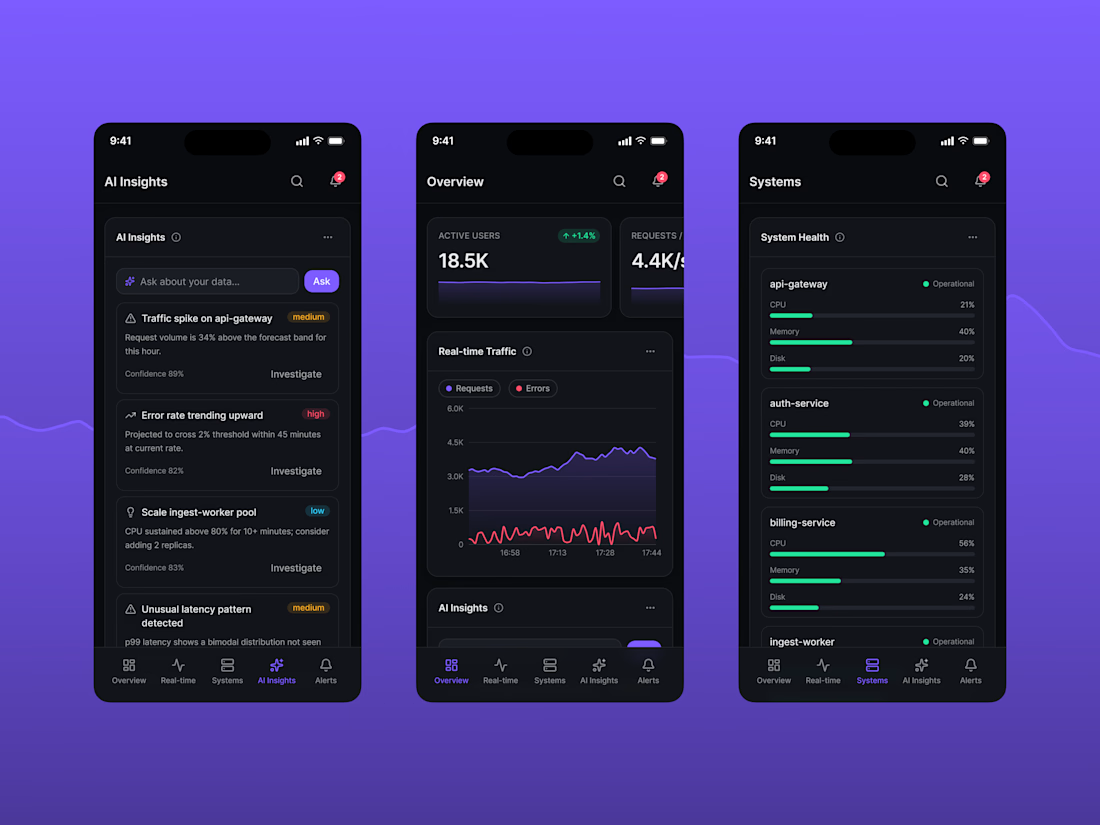
• AI Insights panel — surfaced anomalies, forecasts, and recommendations with confidence scores, plus a natural-language "ask your data" input
• System health grid — per-service CPU/memory/disk with threshold-based status coloring
• Anomaly detection — forecast bands with flagged outliers, so deviations are visible instantly, not buried in a table
• Live event stream & prioritized alerts — filterable, pausable, built for triage under pressure
🖼️ Design approach
Dark, high-contrast UI with a disciplined accent palette — color is used only to carry meaning (status, severity, trend), never decoration. Typography and spacing follow a strict 8px grid for consistency across dozens of data-dense components. Every widget has its own loading, empty, and error state — because a dashboard that only looks good with perfect data isn't production-ready.
🖥️ Fully responsive from a 375px phone to a 1920px ultra-wide monitor, with distinct, hand-tuned layouts for mobile, tablet, and desktop — not just a squeezed version of the same grid.