The network for creativity
Join 1.25M professional creatives like you
Connect with clients, get discovered, and run your business 100% commission-free
Creatives on Contra have earned over $150M and we are just getting started
Back to feedPost

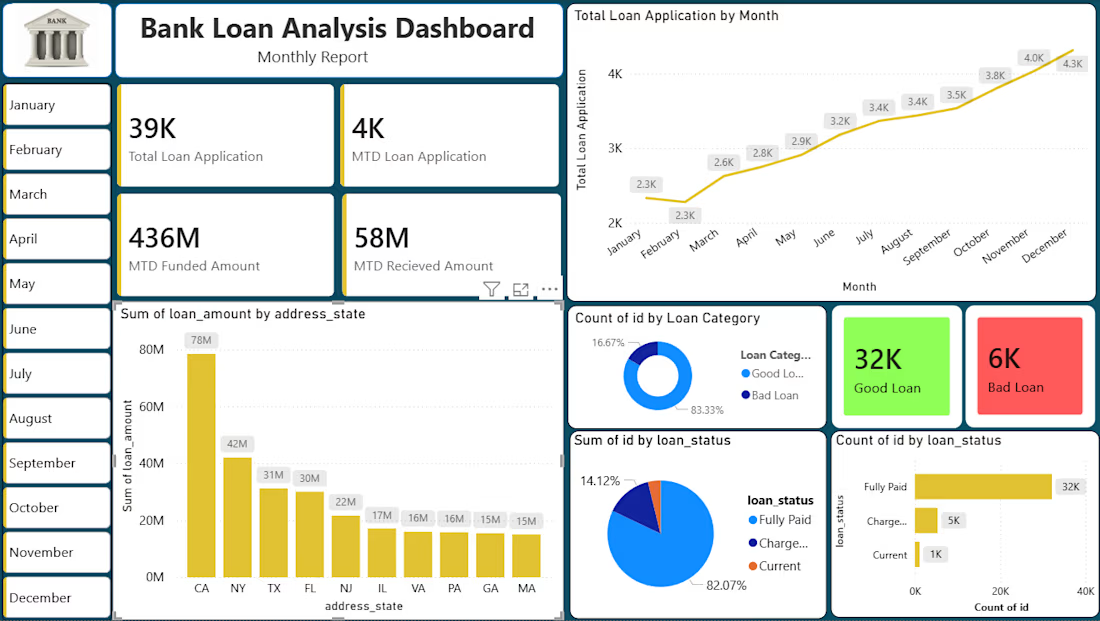
Created an interactive Power BI dashboard to analyze loan applications, funded amounts, loan quality, and borrower trends. Used Power Query and DAX to clean data, create measures, and visualize key insights.

The network for creativity
Join 1.25M professional creatives like you
Connect with clients, get discovered, and run your business 100% commission-free
Creatives on Contra have earned over $150M and we are just getting started




Related posts

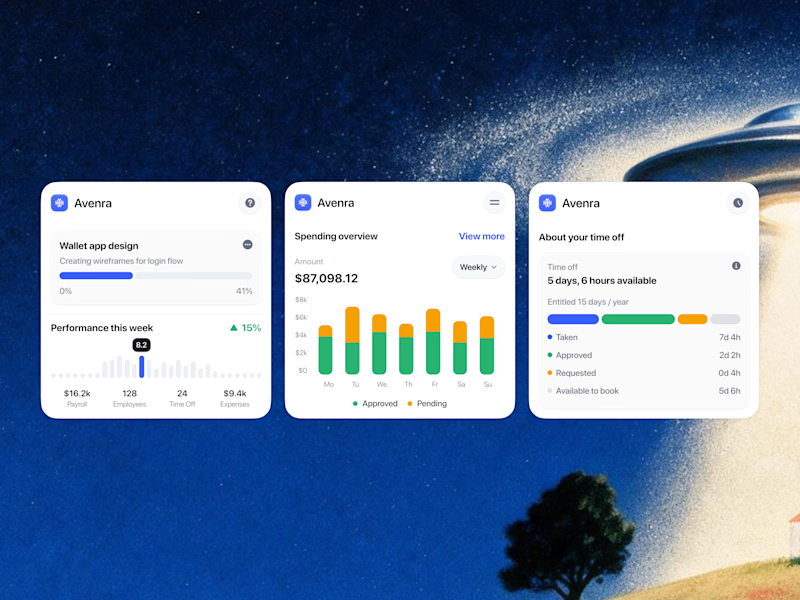
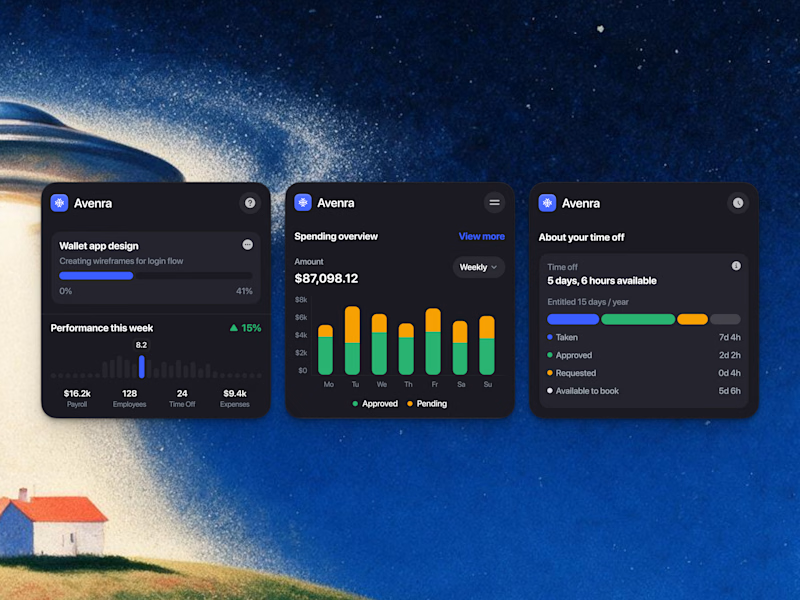
Which style wins for you? 🤔
We’re testing out two theme directions for Avenra’s dashboard component cards; featuring real-time spending breakdowns, project progress metrics, and time-off tracking.
Curious to hear your thoughts! 💬

8 voted
42%
11 voted
58%
19 votes
Closed

Energy communities need to manage a lot at once: consumption, generation, members, billing, reports, alerts, and operational changes.
Wattbank explores a clearer SaaS dashboard experience for energy community operators. The interface brings key metrics, energy balancing, participant distribution, billing, reporting, and insights into one workspace that is easy to scan and act on.
The goal was to move away from heavy energy software and create something more visual, human, and operationally useful.

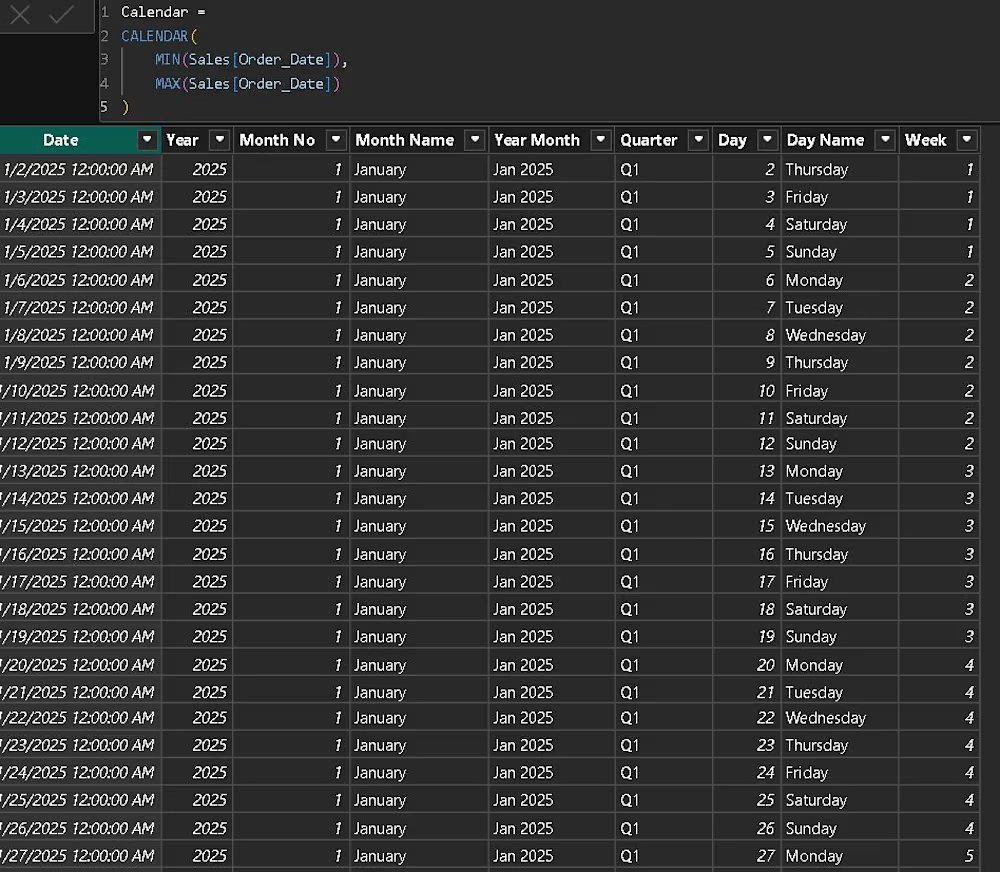
Power BI – Calendar Table using DAX
Aaj maine Power BI mein Calendar Table create ki aur usme different date-related columns banaye:
📅 Daily / Weekly / Monthly analysis
📈 YTD, MTD & QTD calculations
🔄 Time Intelligence
📊 Month-over-Month comparison
📆 Date-based slicers
📉 Sales trends
1️⃣ Calendar Table
Calendar = CALENDAR( MIN(Sales[Order_Date]), MAX(Sales[Order_Date]) )
2️⃣ Year
Year = YEAR('Calendar'[Date])
3️⃣ Month Number
Month No = MONTH('Calendar'[Date])
4️⃣ Month Name
Month Name = FORMAT('Calendar'[Date], "MMMM")
5️⃣ Year Month
Year Month = FORMAT('Calendar'[Date], "MMM YYYY")
6️⃣ Quarter
Quarter = "Q" & QUARTER('Calendar'[Date])
7️⃣ Day
Day = DAY('Calendar'[Date])
8️⃣ Day Name
Day Name = FORMAT('Calendar'[Date], "dddd")
9️⃣ Week Number
Week = WEEKNUM('Calendar'[Date], 2)
🎯 Why Calendar Table?
A proper Calendar Table is very useful for:
📅 Daily / Weekly / Monthly analysis
📈 YTD, MTD & QTD calculations
🔄 Time Intelligence
📊 Month-over-Month comparison
📆 Date-based slicers
📉 Sales trends
Learning Power BI one step at a time! 🚀
I’d love to know from experienced Power BI users:
Is there anything else you would add to this Calendar Table?