
Saransh Purohit
Data Analyst | SQL & Power BI Specialist
New to Contra
Saransh is ready for their next project!
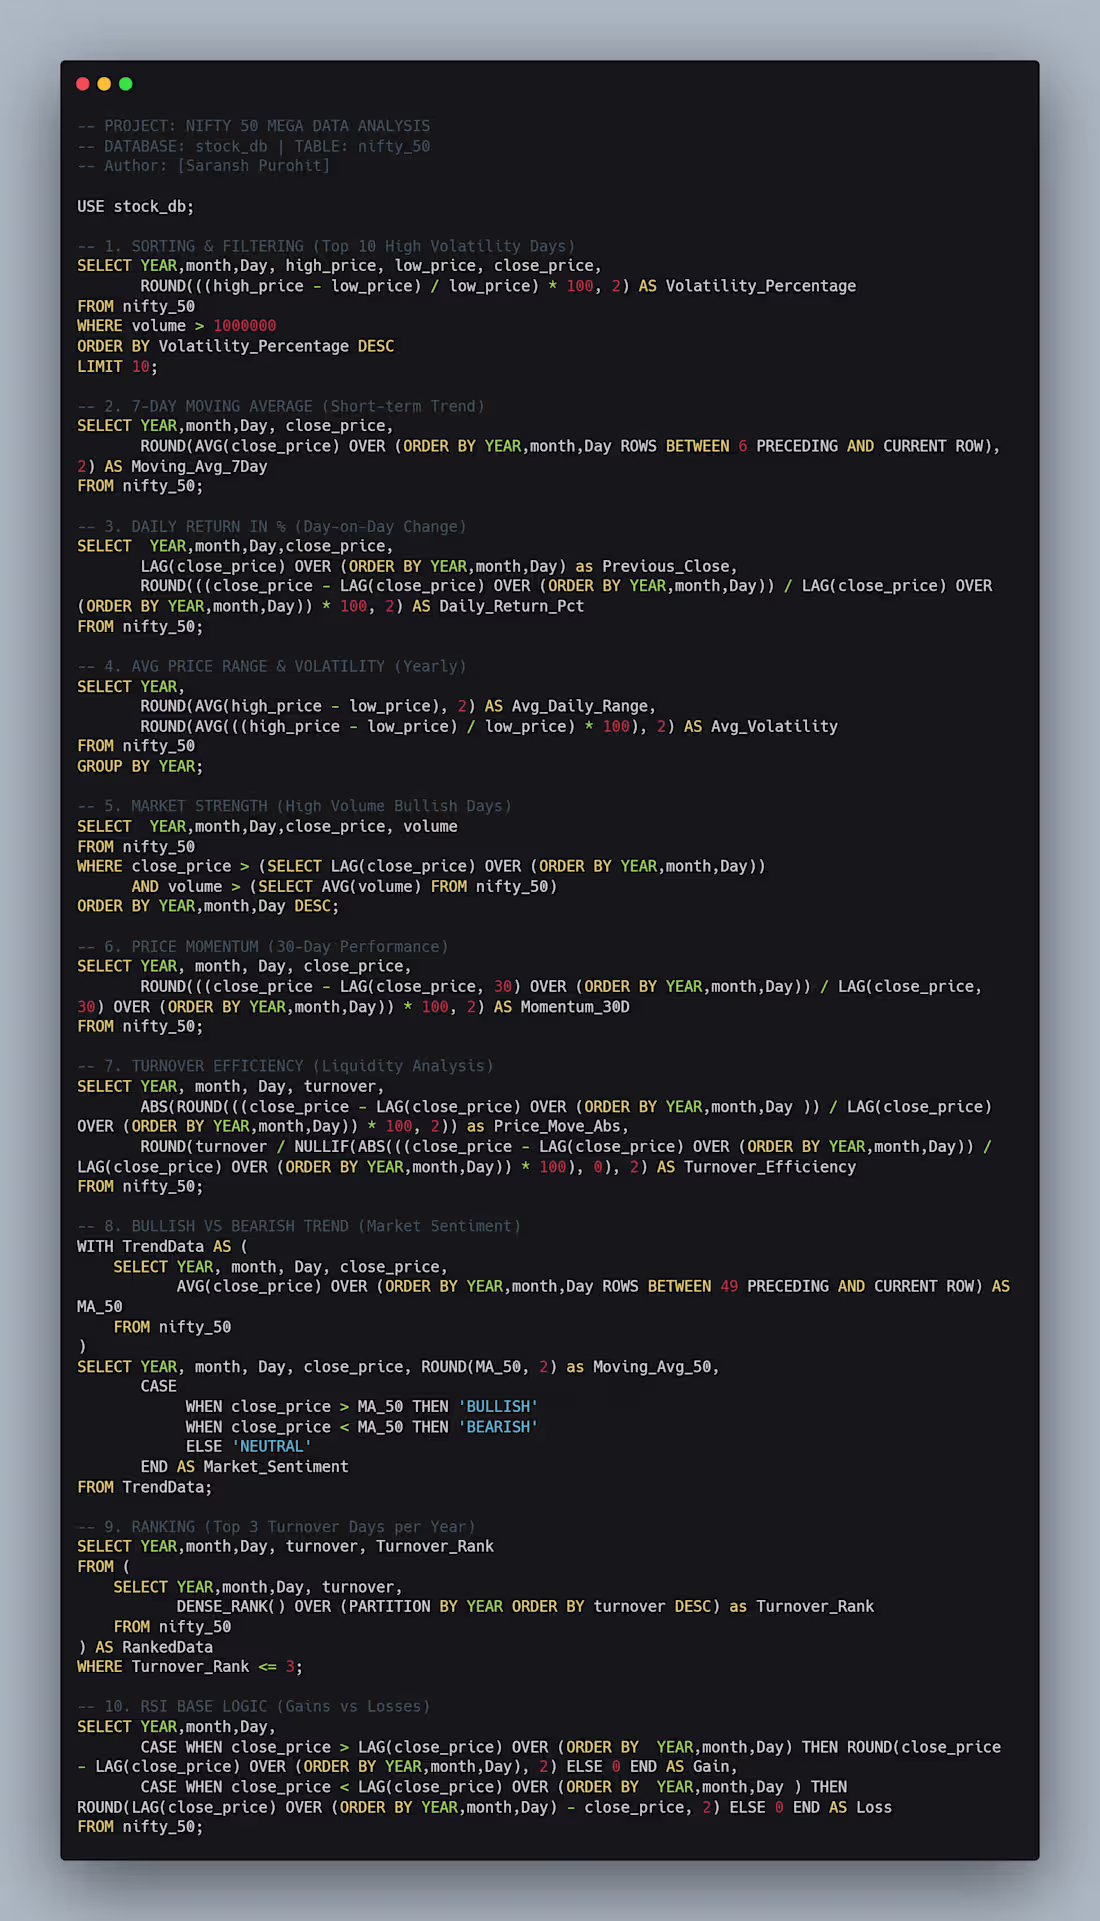
In this technical deep-dive, I engineered a robust SQL script to extract high-level financial insights from 20+ years of Nifty 50 data. I moved beyond basic queries to implement complex analytical functions that simulate real-world market tracking.
Market Sentiment Logic: Developed a CASE-based classifier to identify Bullish/Bearish trends using 50-day Moving Averages.
Volatility & Risk: Calculated day-on-day price fluctuations and ranked high-risk trading days.
Momentum Tracking: Integrated window functions (LAG/LEAD) to compute RSI-base logic and 30-day price momentum.
Efficiency Metrics: Analyzed Turnover Efficiency to understand market liquidity during peak trading hours.
This project demonstrates my ability to handle large-scale financial datasets and translate raw numbers into strategic market indicators.
1
35
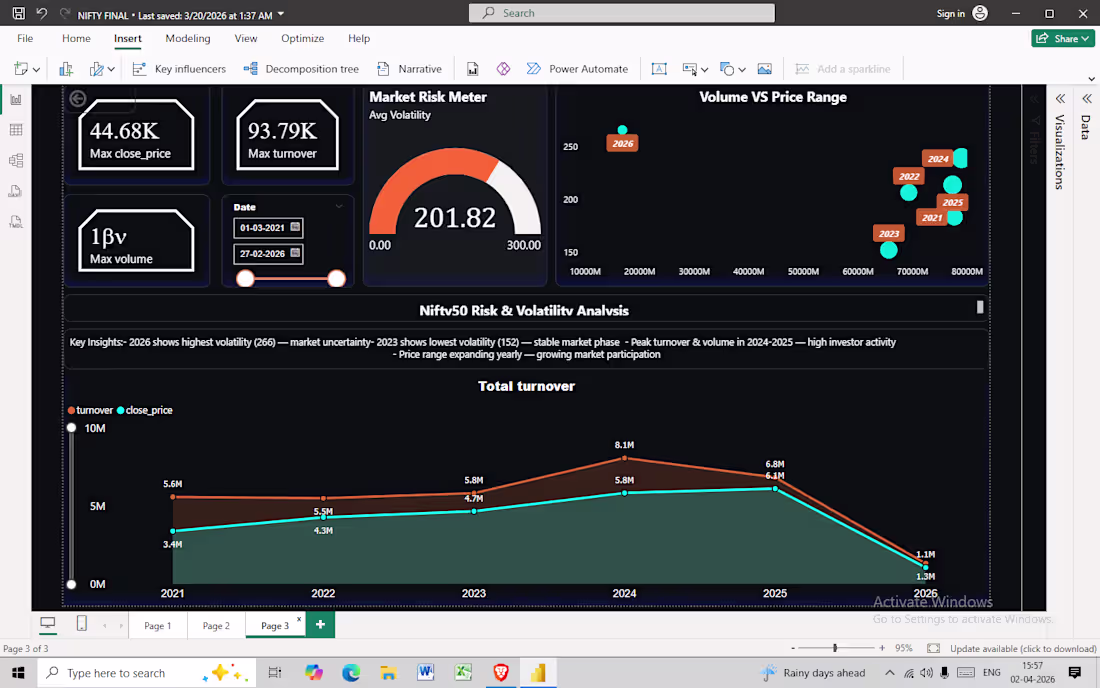
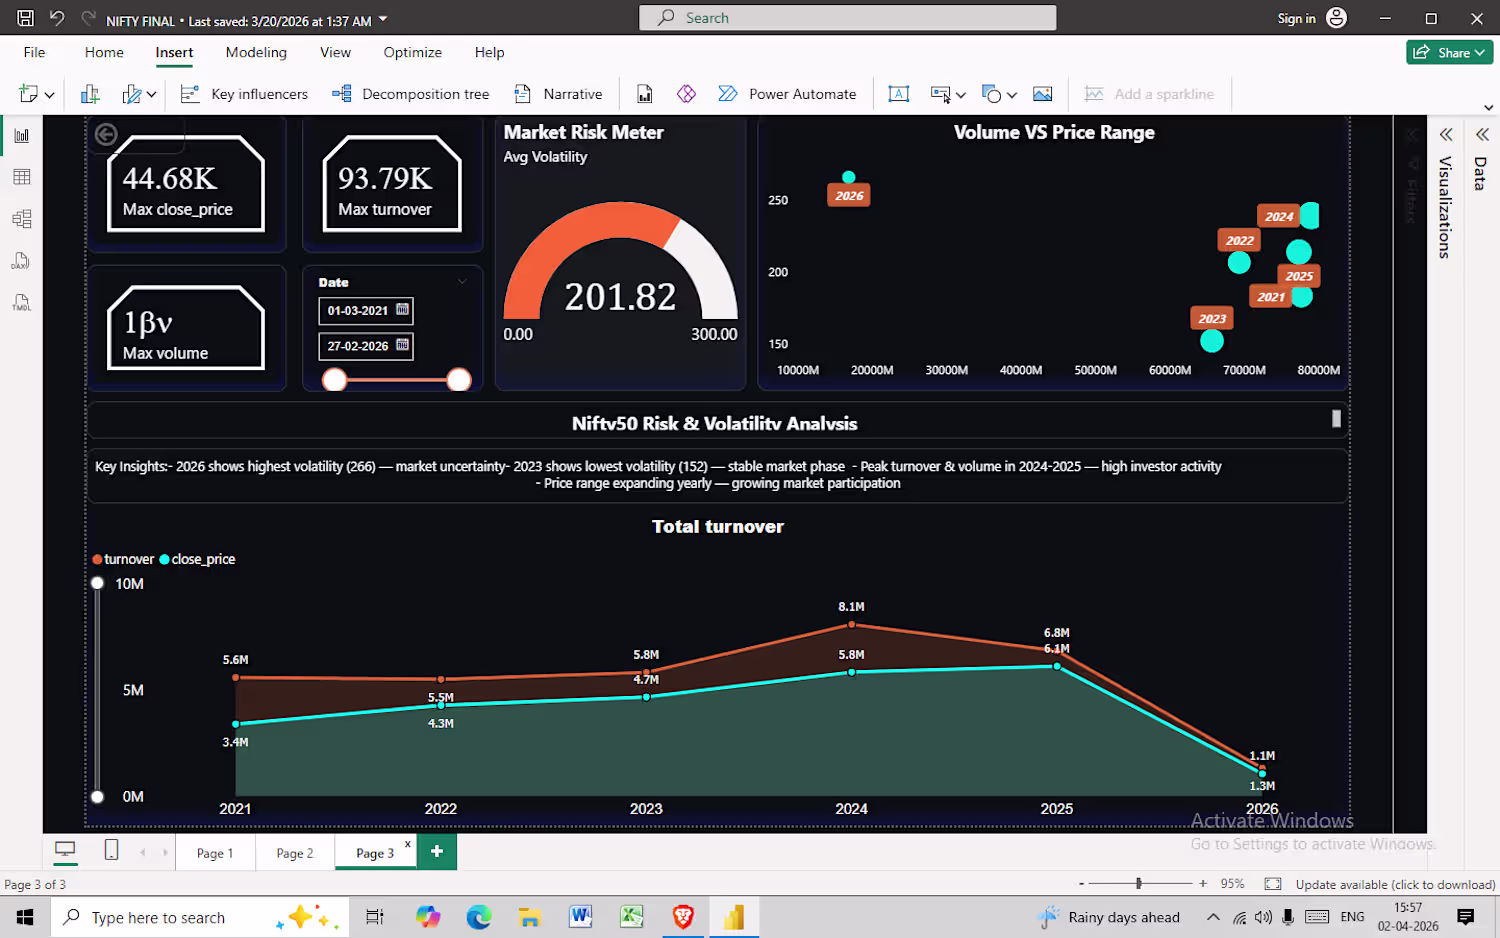
Risk management analysis
0
14
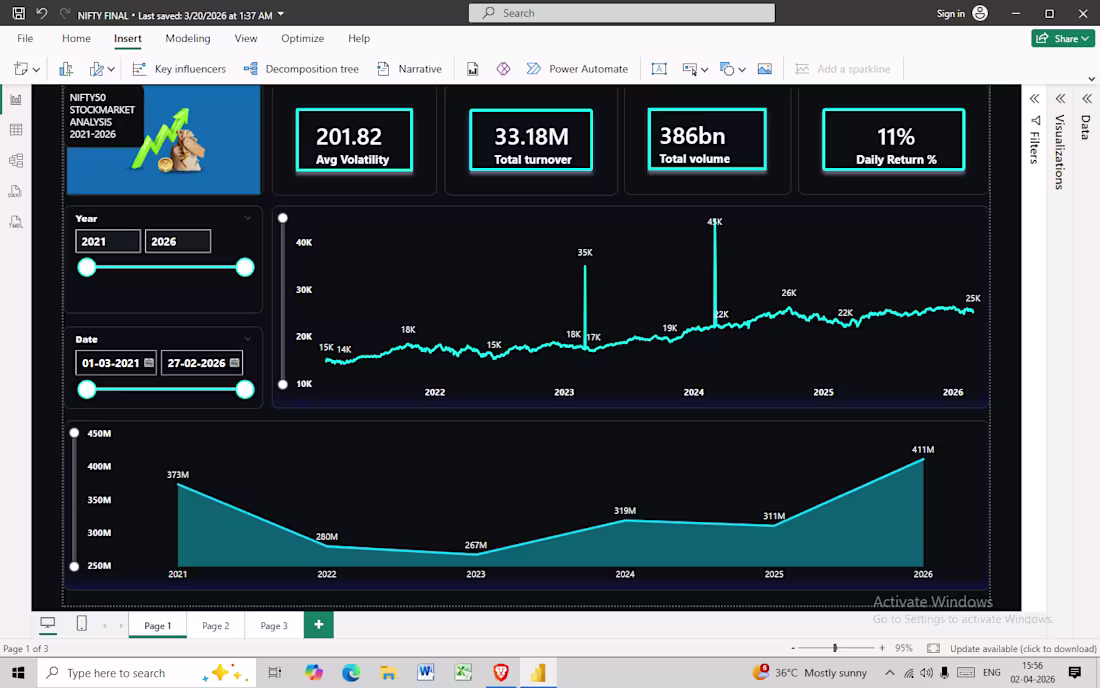
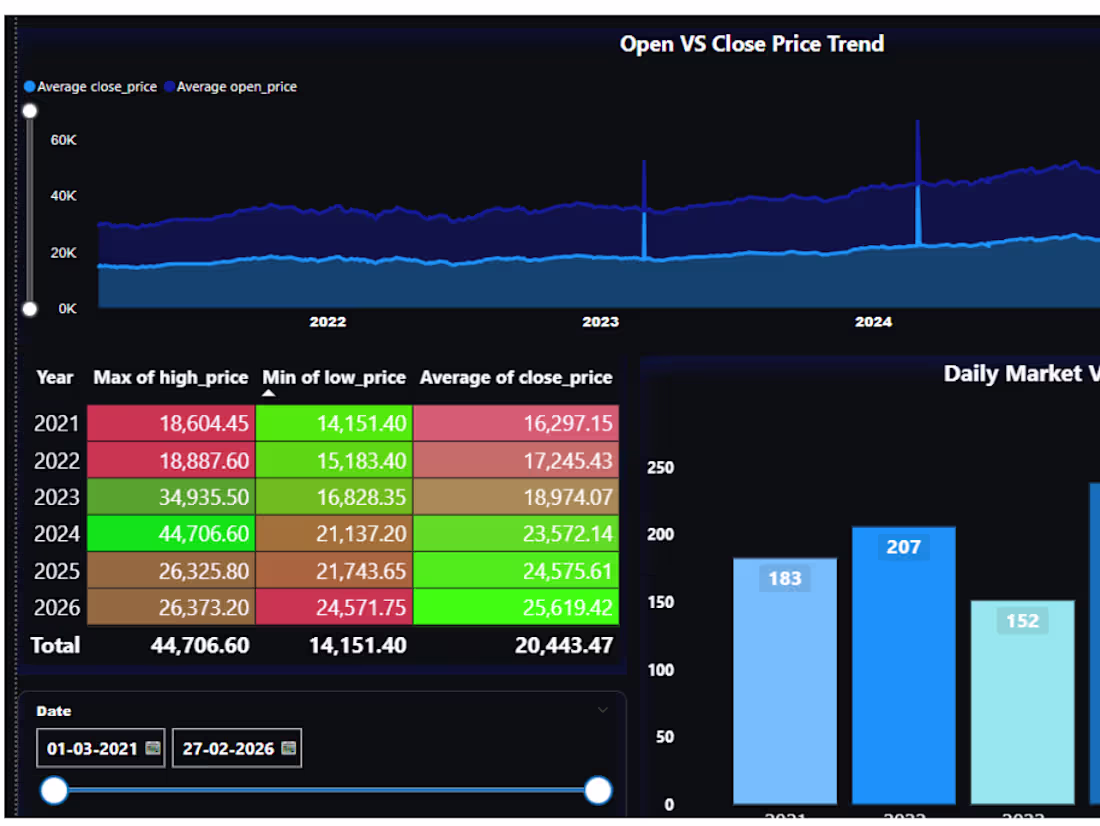
Developed a comprehensive Stock Market Analysis tool using SQL and Power BI to visualize Nifty 50 data.
Data Processing: Cleaned and transformed raw financial datasets using Excel and SQL queries.
Interactive Visuals: Built 3 dynamic dashboards tracking price trends, volatility, and sectoral rotations.
Business Insights: Identified key market drivers and risk factors through historical data analysis.
Financial Expertise: Proven experience in stock market data analysis (Nifty 50).
Tech Stack: Power BI, SQL, Microsoft Excel.
3
104
Nifty 50 Stock Market Analysis
0
2