
Samuel Maina
Freelance Data Analyst | SQL, Excel, and Power BI Expert.
New to Contra
Samuel is building their profile!

Crime Insights & Trends Analysis Dashboard
Project Overview
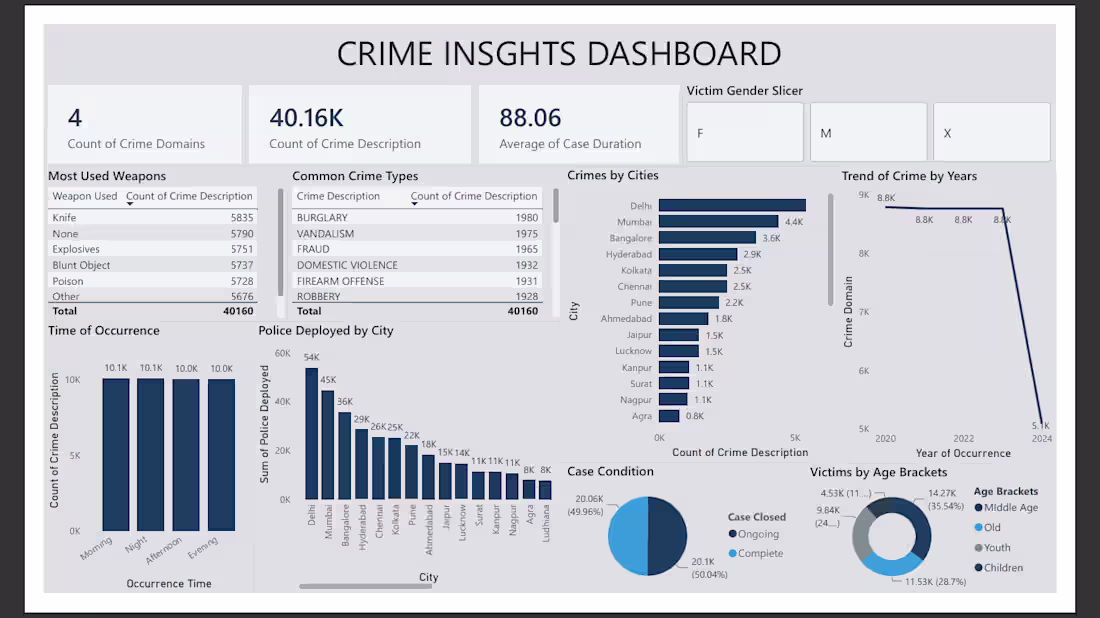
This project involved the end-to-end processing of a large-scale crime dataset containing over 40,000 records. The goal was to transform raw, unstructured data into a high-impact, interactive dashboard to drive data-informed decision-making for police resource allocation and public safety awareness.
Technical Execution
Data Cleaning & Manipulation (SQL): Utilized complex SQL queries to clean and normalize a raw dataset of 40,000 rows. This involved handling null values, standardizing crime descriptions, and aggregating metrics by city, weapon type, and time of occurrence to ensure data integrity before visualization.
Analytical Modeling: Developed calculated fields and measures within the SQL environment to derive key performance indicators (KPIs), such as the average case duration and frequency of crime domains.
Data Visualization (Power BI): Constructed a comprehensive, interactive Power BI dashboard to visualize trends. Key features include:
Trend Analysis: A multi-year line chart tracking crime progression from 2020 to 2024.
Geospatial & Resource Analysis: A comparative analysis of crimes by city against police deployment levels to identify coverage gaps.
Demographic Insights: Integrated victim gender slicers and age-bracket segmentation to provide deeper social context to the raw crime numbers.
Results & Impact
The final dashboard provides an intuitive interface for stakeholders to filter data by victim profile, time of day, and geographic location. This project demonstrates my ability to handle large datasets, perform rigorous data cleaning using SQL, and build professional-grade dashboards that turn complex information into actionable insights.
1
33
SQL Data Engineering: Cleaning & Structuring the EV Dataset
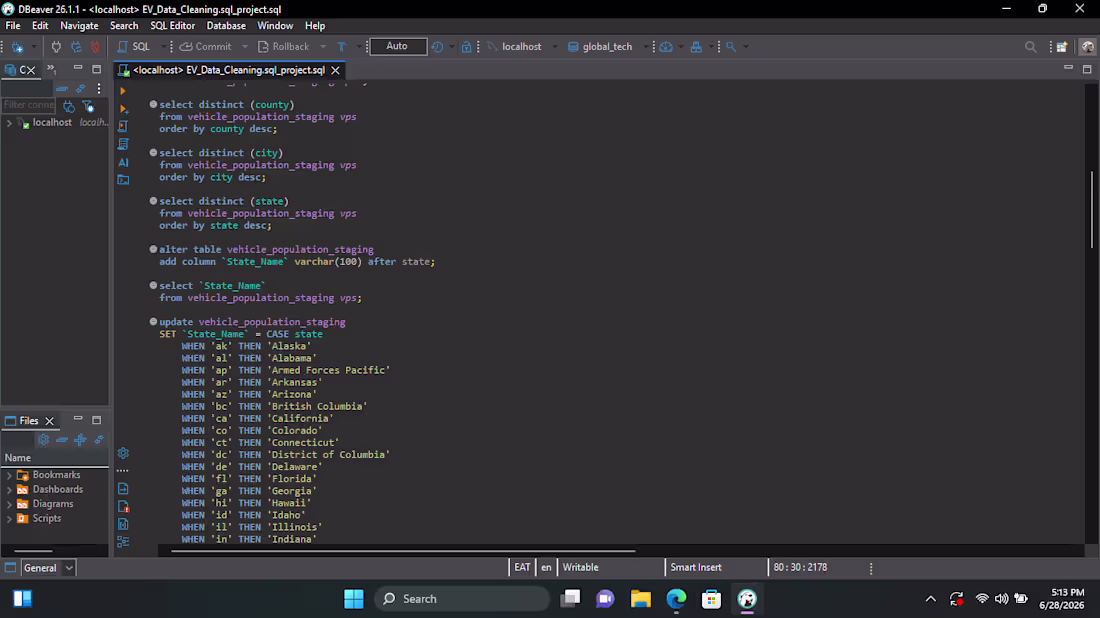
Before building the frontend visualizations, I handled the end-to-end data engineering and cleaning for the Electric Vehicle population data using PostgreSQL/SQL syntax within DBeaver.
Technical Database Operations Performed:
Data Auditing & Profiling: Utilized SELECT DISTINCT queries across core categorical fields (County, City, State) to identify structural inconsistencies, data entry anomalies, and trailing whitespaces.
Schema Alteration: Executed ALTER TABLE commands to structurally expand the staging database layout, introducing new calculated columns like State_Name to handle descriptive data mapping.
Conditional Data Standardization: Wrote robust, multi-conditional UPDATE scripts paired with extensive CASE WHEN logic to map and standardize short state abbreviations into full, clean geographical records (e.g., transforming 'ak' to 'Alaska', 'ca' to 'California').
Optimization for BI: Structured the final staging views to minimize overhead, ensuring seamless, high-performance importing and star-schema modeling once connected to Power BI.
1
39
Amazon Sales Performance Dashboard
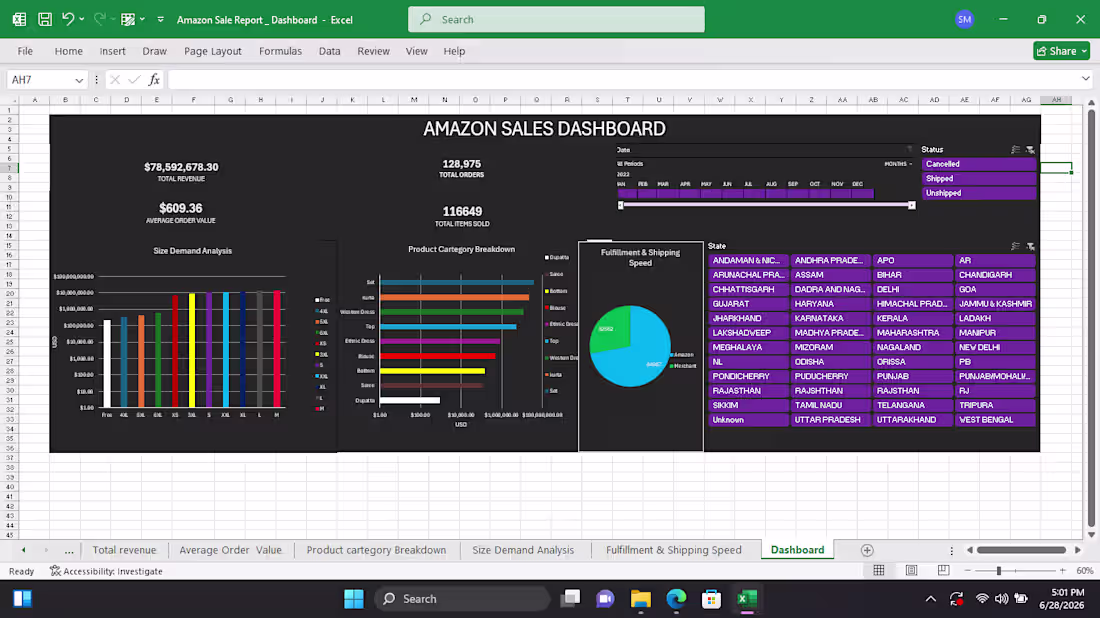
Developed a fully interactive, dynamic e-commerce dashboard inside Microsoft Excel to analyze sales trends, operational fulfillment metrics, and distribution performance for Amazon sales data.
Key Features & Analytical Breakdown:
Executive Revenue Tracking: Analyzes over $78.5M in Total Revenue, tracking 128K+ Total Orders and keeping a precise gauge on an Average Order Value of $609.36.
Product & Demand Analysis: Features localized bar charts breaking down performance by product categories and a comprehensive 'Size Demand Analysis' to track high-volume inventory movement.
Logistics & Fulfillment Operations: Built pie charts detailing Fulfillment & Shipping Speed alongside dynamic status trackers (Cancelled, Shipped, Unshipped) to spot supply chain bottlenecks.
Dynamic Slicers & State Filters: Programmed fully interactive Excel slicers to filter performance seamlessly by individual state markets.
1
48
Electric Vehicle (EV) Population Dashboard
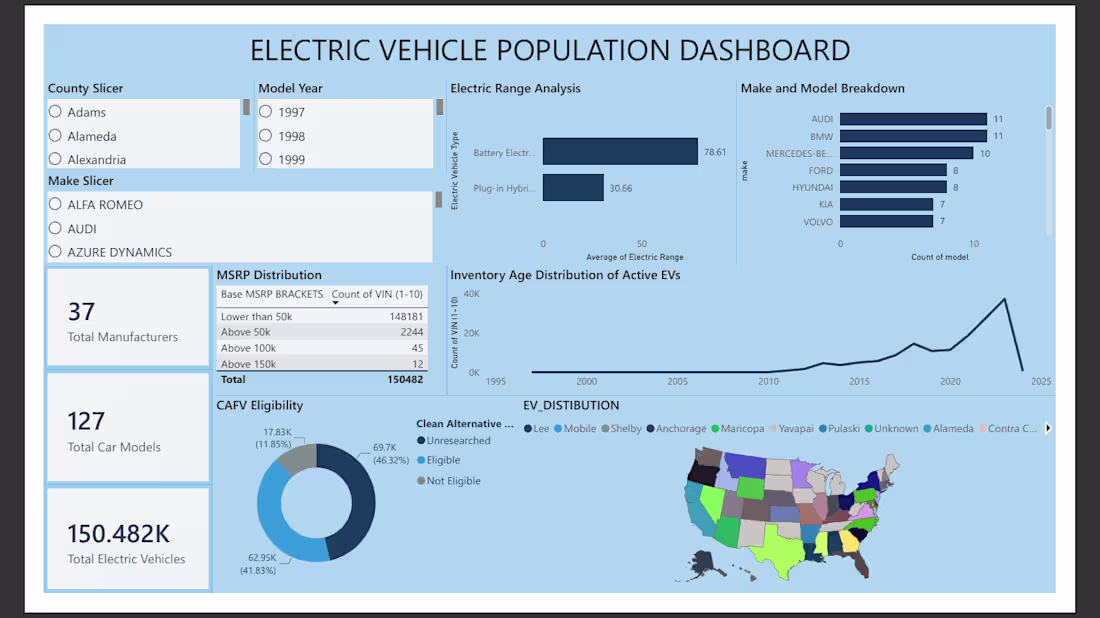
I designed and developed this interactive Power BI dashboard to analyze the growth, distribution, and market composition of over 150,000 electric vehicles.
Key Features & Insights Visualized:
Executive Metrics: Tracks 150.4K+ total electric vehicles across 37 manufacturers and 127 unique car models.
Interactive Filtering: Built dynamic slicers filtering data seamlessly by County, Model Year, and Vehicle Make.
Market Breakdown: Features an analysis of battery type distributions (BEV vs. PHEV), MSRP price brackets, and Clean Alternative Fuel Vehicle (CAFV) eligibility.
Trend & Geographic Analysis: Includes an inventory age growth curve tracking active EV adoption over time, paired with a geographic distribution map.
Power BI |Data Analytics |Data Visualization |Data Modeling
1
55