The network for creativity
Join 1.25M professional creatives like you
Connect with clients, get discovered, and run your business 100% commission-free
Creatives on Contra have earned over $150M and we are just getting started
Back to feedPost
Bakery Sales Dashboard: Power BI
Walkthrough of a full sales analytics project for a bakery chain with 14 store locations. The raw data arrived across two separate tables (sales and price) with duplicates and no clean relationship between them I used SQL to handle the join and cleanup before anything touched Power BI.
A deeper issue turned up in the location data: cities and states were mixed into the same field, which would have broken any regional reporting. Fixed that at the source before building out the model.
What the dashboard delivers:
Revenue, transaction, and unit tracking across $44.8M in sales
Product performance broken down by time of day, surfacing which items to keep in stock and which to reconsider
Store-level benchmarking that flags underperforming locations against top performers like Florida
A dedicated Insights page with findings and recommendations, not just charts I also built for someone with zero Power BI experience to open and understand immediately
Tools: SQL, Power Query, Power BI, DAX
Video above walks through the full dashboard, page by page.


The network for creativity
Join 1.25M professional creatives like you
Connect with clients, get discovered, and run your business 100% commission-free
Creatives on Contra have earned over $150M and we are just getting started
Trending
retrofuturism
Share your favorite designs from the past exploring the distant future. Or your own take on the aesthetic 🚀
halftone
Dots. Texture. Grain. Let's see your designs using the halftone technique.

Midjourney
Creatives are showing off what they're making with Midjourney.
colorgrade
Video editors sound off: How do you enhance the mood of your video in color grading?


Related posts

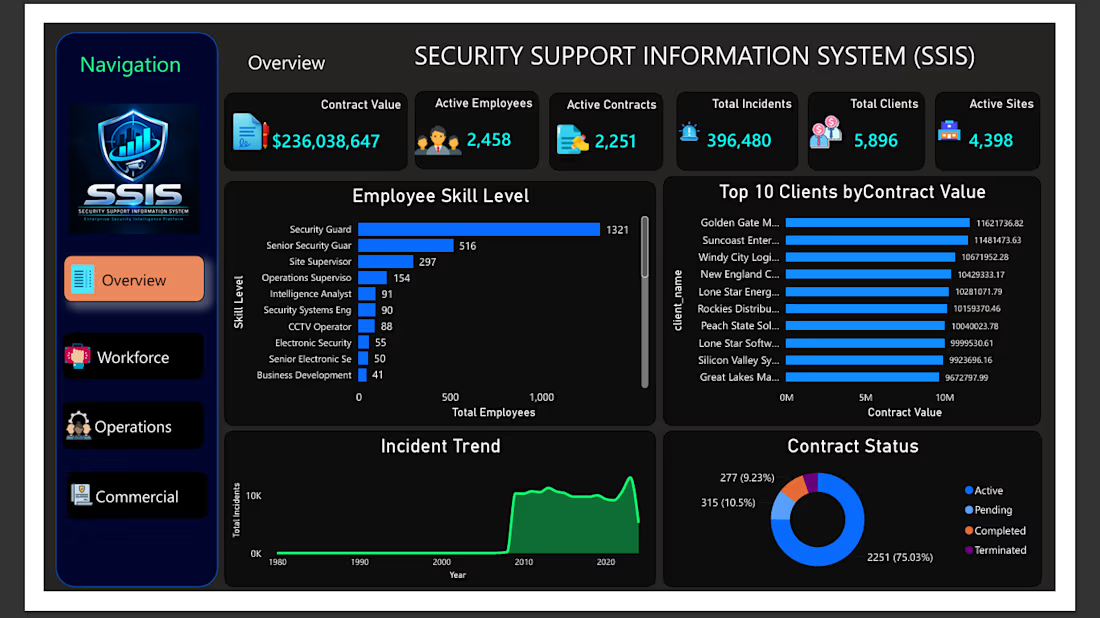
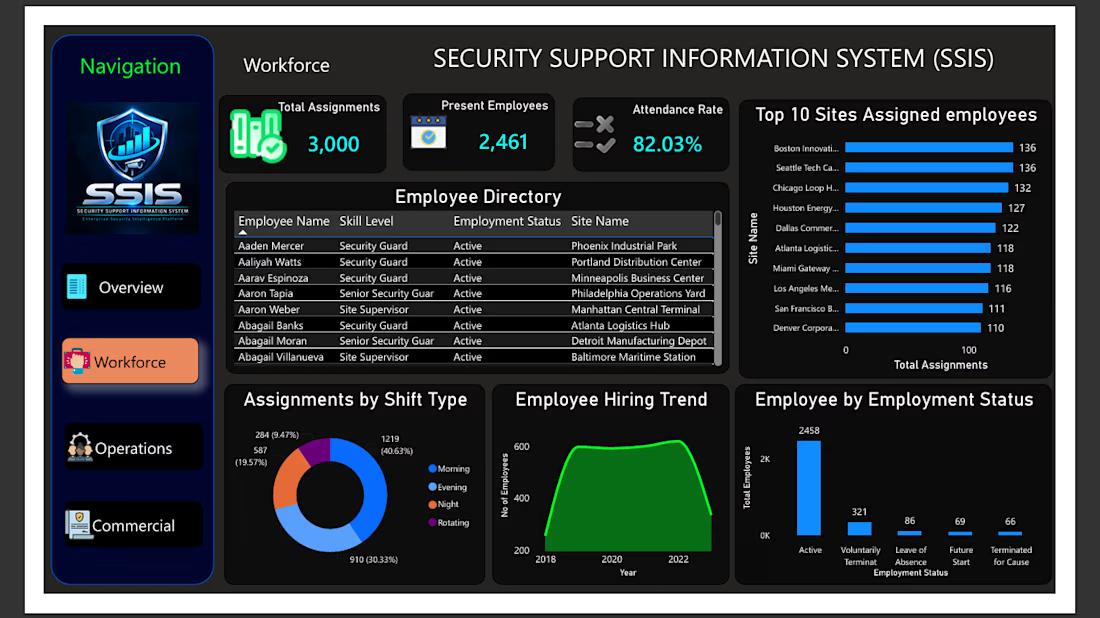
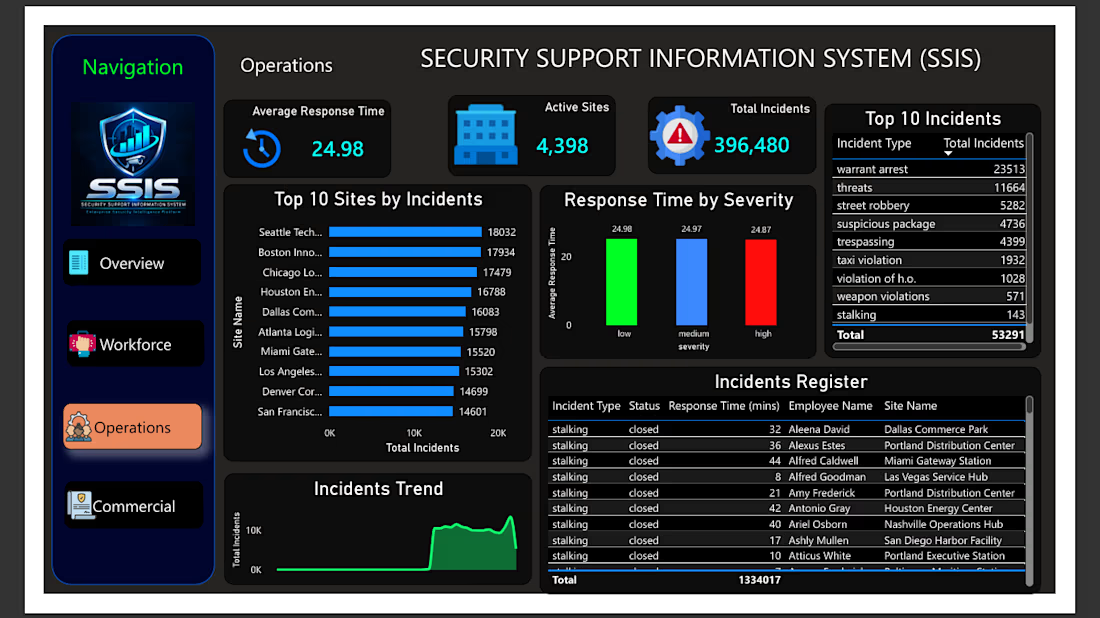
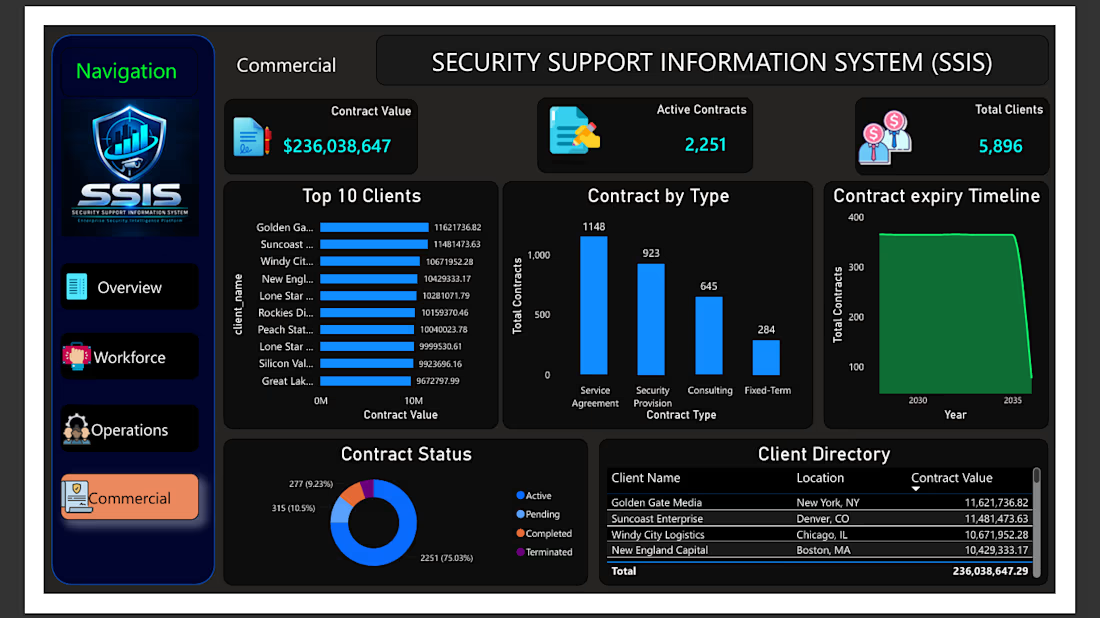
Security Support Information System (SSIS)
The Security Support Information System (SSIS) is an end-to-end Business Intelligence solution developed to address operational visibility and decision-making challenges in the private security industry.
The project involved identifying a real business problem, cleaning and transforming operational datasets using Python (Pandas), designing a relational MySQL database, implementing SQL scripts, and developing interactive Power BI dashboards.
The final solution delivers Executive, Workforce, Operations, and Commercial Analytics dashboards featuring KPI reporting, DAX calculations, and interactive visualizations to help managers make informed, data-driven decisions.
Tools Used: Python (Pandas), MySQL, SQL, Microsoft Power BI, DAX, Excel.



Stop letting manual follow-ups and leaky funnels stall your growth.
True lead generation isn't about chasing cold contact.
It's about building automated, zero-friction systems that capture and convert traffic effortlessly.
Optimize your pipeline, scale your outreach, and let infrastructure do the heavy lifting.
Data AnalysisSoftware ArchitectureleadgenerationbusinessgrowthworkflowautomationSystems EngineeringDockerHubSpotN8N


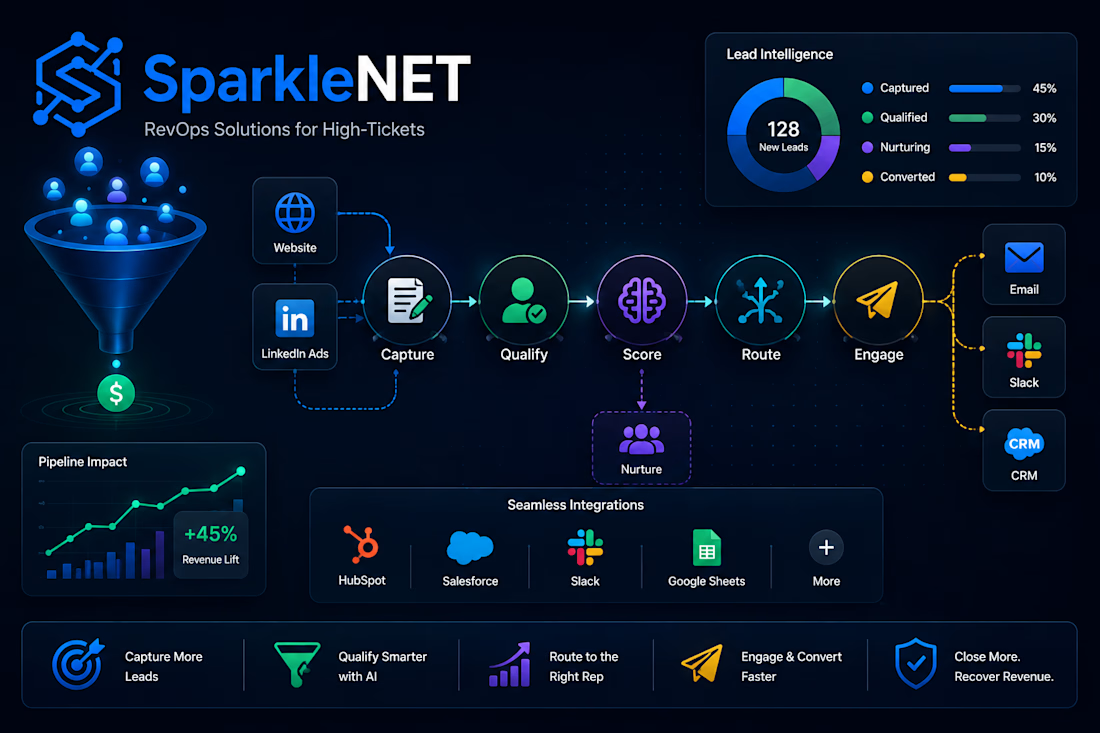


For high ticket specifically, zero friction can work against you at the wrong step. capture & routing should be instant but the moment a real buyer expects a human usually right after qualifying, that is where automation should hand off not close the loop entirely

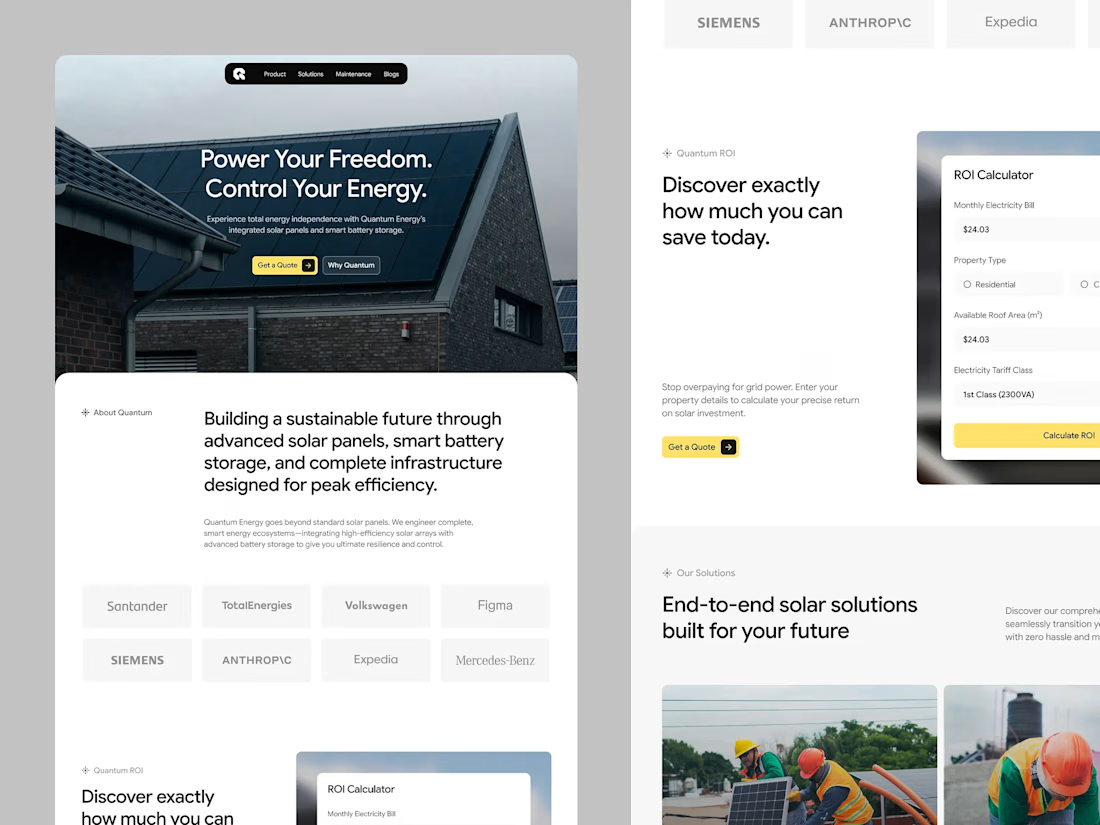
A sustainable energy platform designed to empower the shift toward renewable power and smart energy solutions with Quantum. Our focus was on combining clean data visuals, strong branding, and a frictionless experience to present green tech at its best.
Check out the full breakdown on our page and drop your feedback below!
📩 Collaborate with Us? Contra Odama Studio


Amazing work👏🔥🔥