The network for creativity
Join 1.25M professional creatives like you
Connect with clients, get discovered, and run your business 100% commission-free
Creatives on Contra have earned over $150M and we are just getting started
Back to feedPost
This interactive retail dashboard was developed to help a large e-commerce store track their sales performance, monitor profit margins, and look for shipping bottlenecks. The project covers everything from cleaning the raw data in SQL to designing a clean, user-friendly business layout.
Technical Workflow & Implementation
SQL Data Cleaning: Used SQL to do all the heavy lifting. I wrote queries to clean the raw dataset, handle date formats, organize the tables, and ensure there were zero duplicates or broken rows.
Excel Data Checks: Used Microsoft Excel to spot-check specific settings, audit row counts, and make sure the numbers matched perfectly before moving them into the final report.
UI/UX Dashboard Design: Designed a high-end, clean dashboard interface. Instead of using standard grid cells, I built the entire layout using custom floating shapes to create seamless containers and eliminate all white spaces, giving it a premium app-like feel.
Dashboard Page-by-Page Breakdown
1. Sales Overview Page
This is the main dashboard page that gives an instant snapshot of how the business is performing globally.
Main Sales KPIs: Displays high-level cards for total sales revenue, total profit margins, and overall order volumes.
Interactive Date Slicers: Features smooth calendar and order date controls so users can slice data by specific years, quarters, or months to see seasonal trends.
Cross-Filtering Map: Includes a dynamic regional map where clicking on any state or territory instantly updates the entire page's metrics.
2. Product Performance Page
This page lets management dive deep into the actual inventory and see what is making money versus what is losing it.
Category & Sub-Category Splits: Breaks down sales and profit performance by categories like Technology, Office Supplies, and Furniture.
Profit Margin Analysis: Highlights low-margin or negative-profit products so the store knows exactly where they are losing money.
Top Selling Products: Visualizes the best-performing items by revenue and order volume to keep track of high-demand stock.
3. Shipping & Logistics Page
This page focuses heavily on operations, tracking how efficiently orders are getting sent out to customers.
Shipping Mode Breakdown: Compares sales and volumes across different shipping methods, like Standard Class vs. Same Day delivery.
Order Delays & Timelines: Tracks the average time it takes for an order to move from the purchase date to the actual ship date.
Regional Logistics Tracking: Lets the operations team filter down by region or state to see where shipping bottlenecks or delivery delays are happening the most.


The network for creativity
Join 1.25M professional creatives like you
Connect with clients, get discovered, and run your business 100% commission-free
Creatives on Contra have earned over $150M and we are just getting started
Trending
retrofuturism
Share your favorite designs from the past exploring the distant future. Or your own take on the aesthetic 🚀
halftone
Dots. Texture. Grain. Let's see your designs using the halftone technique.

Midjourney
Creatives are showing off what they're making with Midjourney.
colorgrade
Video editors sound off: How do you enhance the mood of your video in color grading?


Related posts

Designed a sleek Crypto Trading Dashboard.
Modern UI with real-time market data, price charts, portfolio overview, order book, trading tools, and insightful analytics for crypto traders.
cryptowalletdashboardcryptodashboarddesignUI DesignUX DesignWeb DesignAdobe After EffectsFigmaWebflow


The dashboard layout feels organized. All the important trading info is easy to find.

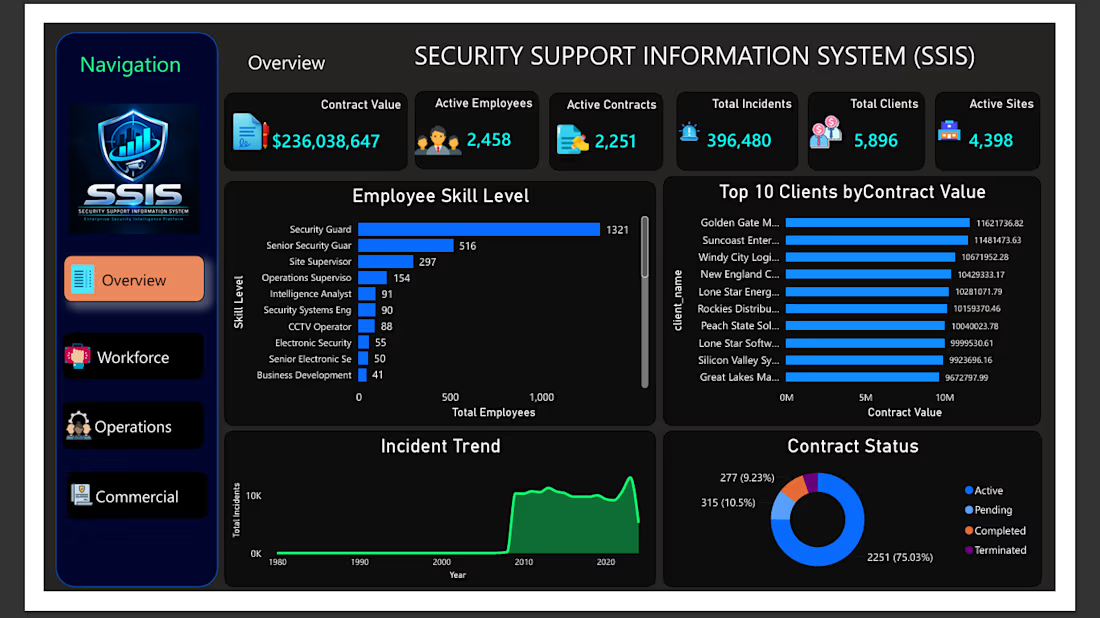
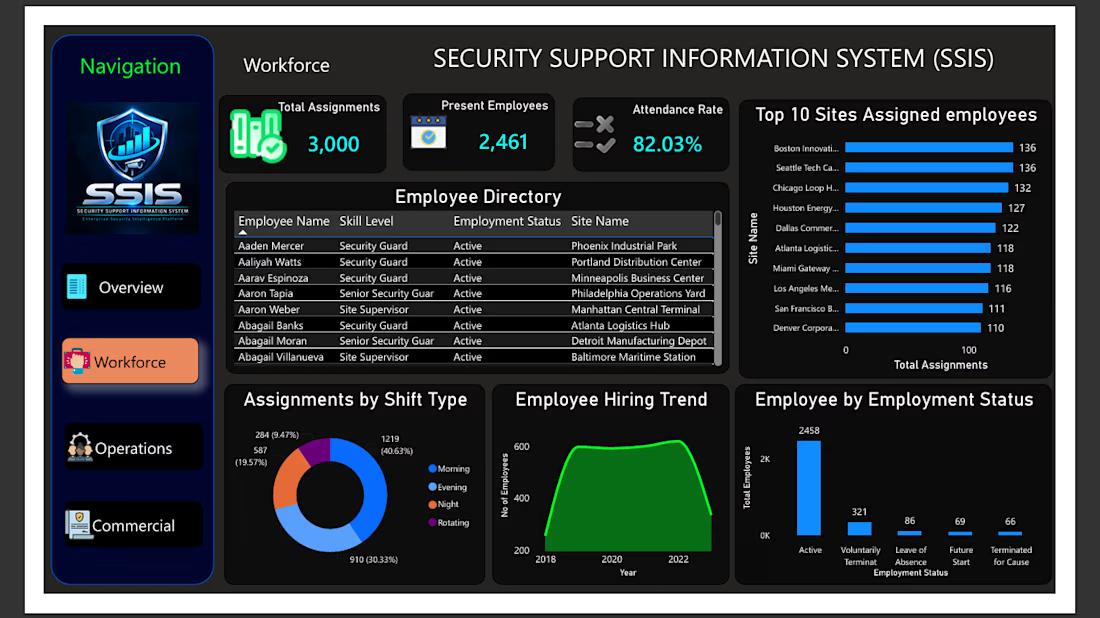
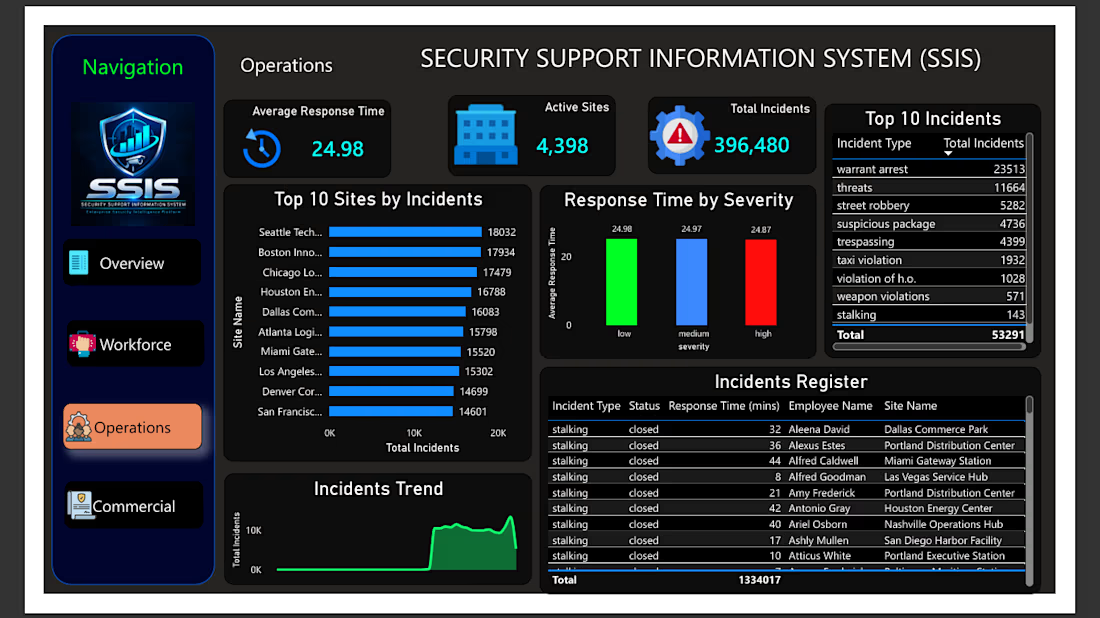
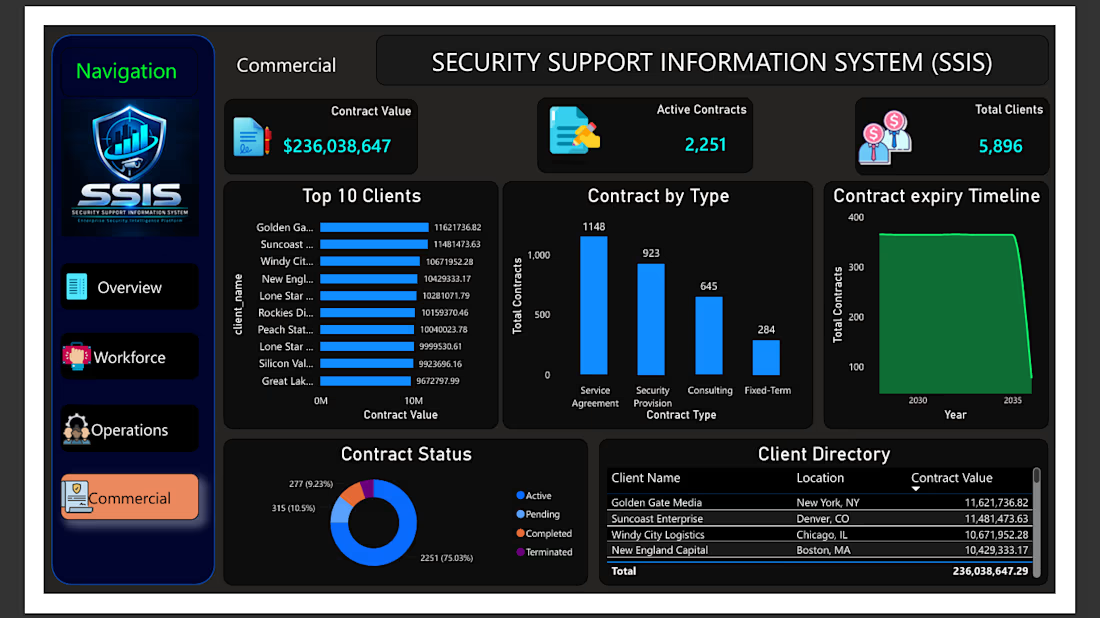
Security Support Information System (SSIS)
The Security Support Information System (SSIS) is an end-to-end Business Intelligence solution developed to address operational visibility and decision-making challenges in the private security industry.
The project involved identifying a real business problem, cleaning and transforming operational datasets using Python (Pandas), designing a relational MySQL database, implementing SQL scripts, and developing interactive Power BI dashboards.
The final solution delivers Executive, Workforce, Operations, and Commercial Analytics dashboards featuring KPI reporting, DAX calculations, and interactive visualizations to help managers make informed, data-driven decisions.
Tools Used: Python (Pandas), MySQL, SQL, Microsoft Power BI, DAX, Excel.


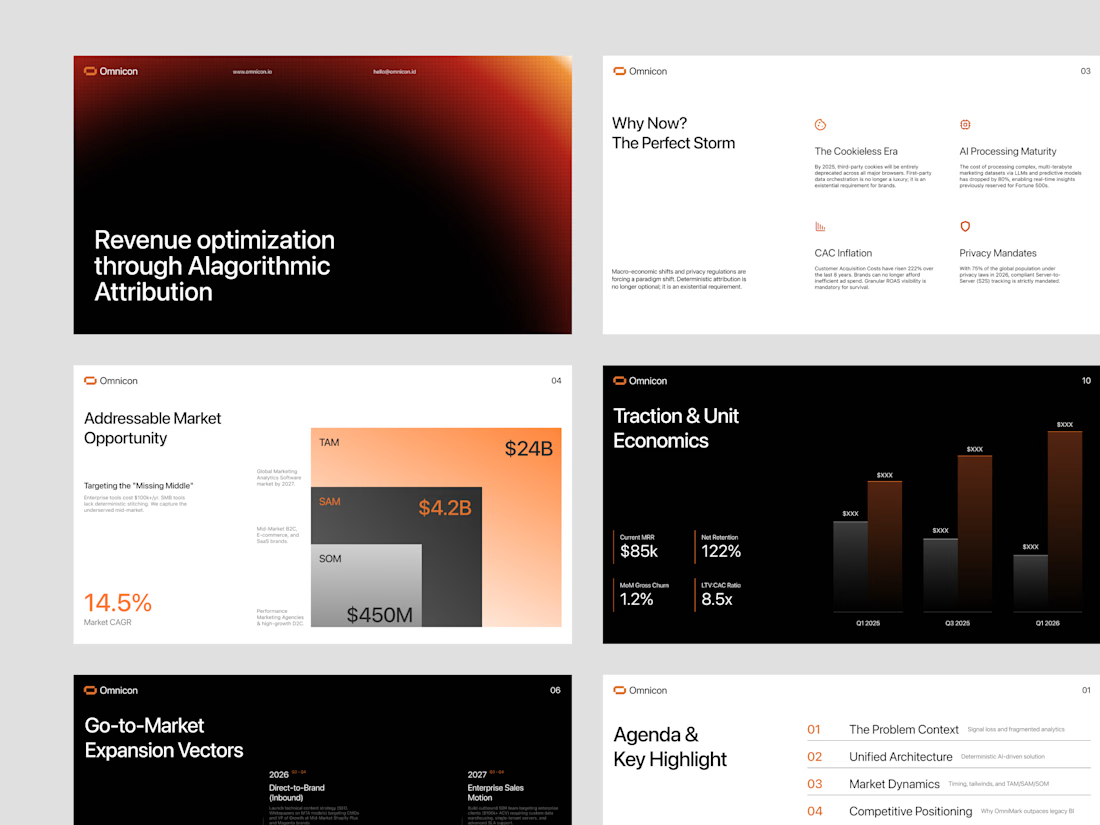
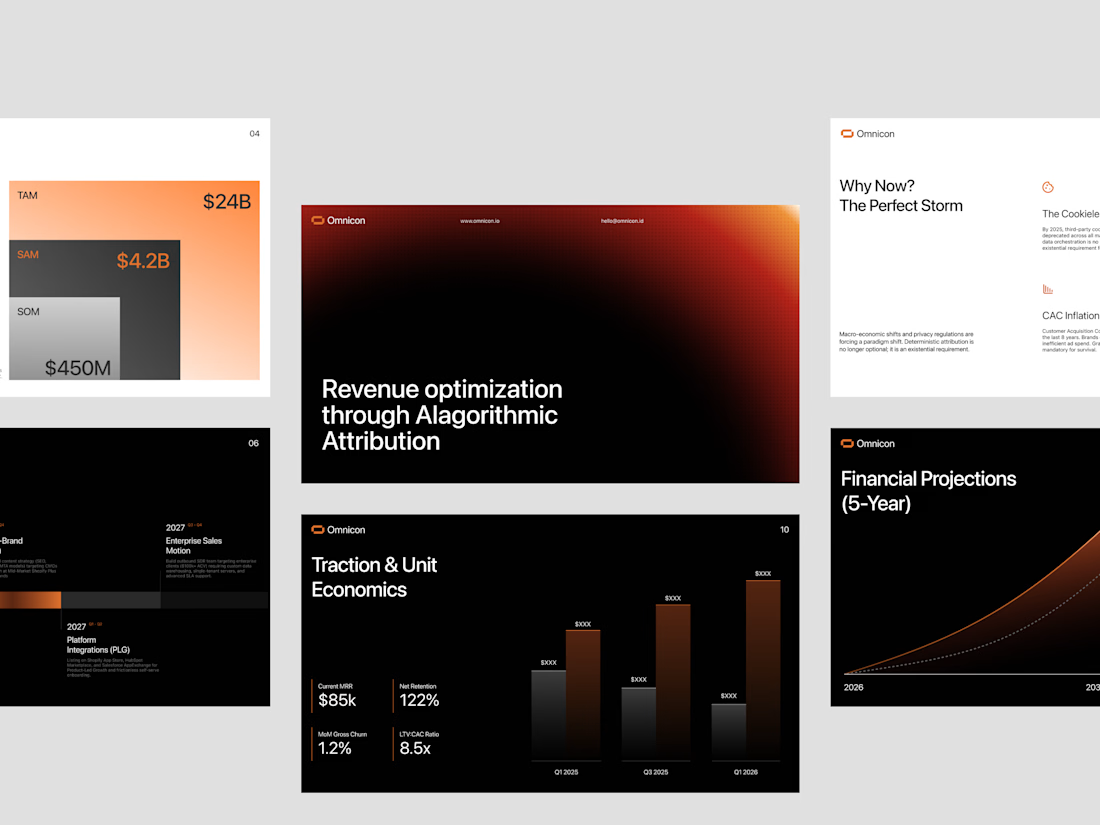
Meet Omnicon — a pitch deck that turns complex marketing analytics into a story investors can follow at a glance. Disciplined black-and-orange visuals meet strong data visualization, from TAM/SAM/SOM breakdowns to traction charts and 5-year projections, making every slide sharp, structured, and easy to absorb. Confident typography and generous spacing keep the narrative clear from problem to financials.
📩 Collaborate with Us? Contra Cansaas Agency