
Samuel Maina
Freelance Data Analyst | SQL, Excel, and Power BI Expert.Nairobi, Kenya
Road Safety Analysis | Python, SQL & Power BI
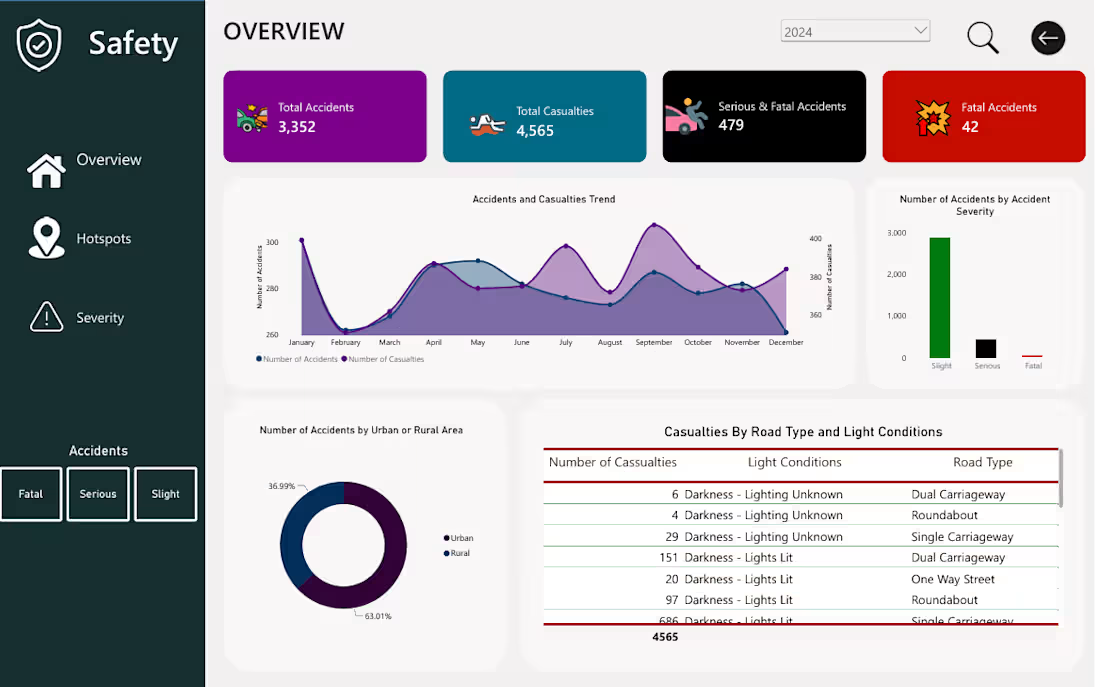
Developed an end-to-end road safety analytics project to help authorities understand accident patterns, identify high-risk areas, and make informed decisions about road safety interventions.
The project involved cleaning and preparing road accident data using Python and Pandas, followed by SQL-based exploratory analysis to investigate accident trends, casualty figures, severity distributions, and geographical patterns.
Using Power BI, I transformed the findings into an interactive dashboard featuring key performance indicators and visualisations that provide an overview of accident activity, highlight trends over time, and reveal differences in accident occurrence across districts and locations.
The analysis also explored accident severity in relation to road types, weather conditions, lighting, and road surface conditions.
Tools used: Python, Pandas, SQL, Power BI.
Project deliverable: An interactive Power BI dashboard supported by data cleaning, transformation, and SQL analysis.
The objective was to turn raw accident data into clear, meaningful insights that can support evidence-based road safety planning and resource prioritisation.
1
112
Retail Inventory and Sales Analysis
Retailers collect plenty of sales and inventory data, but turning it into useful decisions about stock, demand, and revenue isn't always straightforward. I built this project to bring those numbers together in one interactive Power BI dashboard.
I used Python and Pandas to clean and prepare the data, handling missing values according to their business meaning, then used MySQL to analyze sales, inventory, discounts, product categories, regions, and seasonal trends.
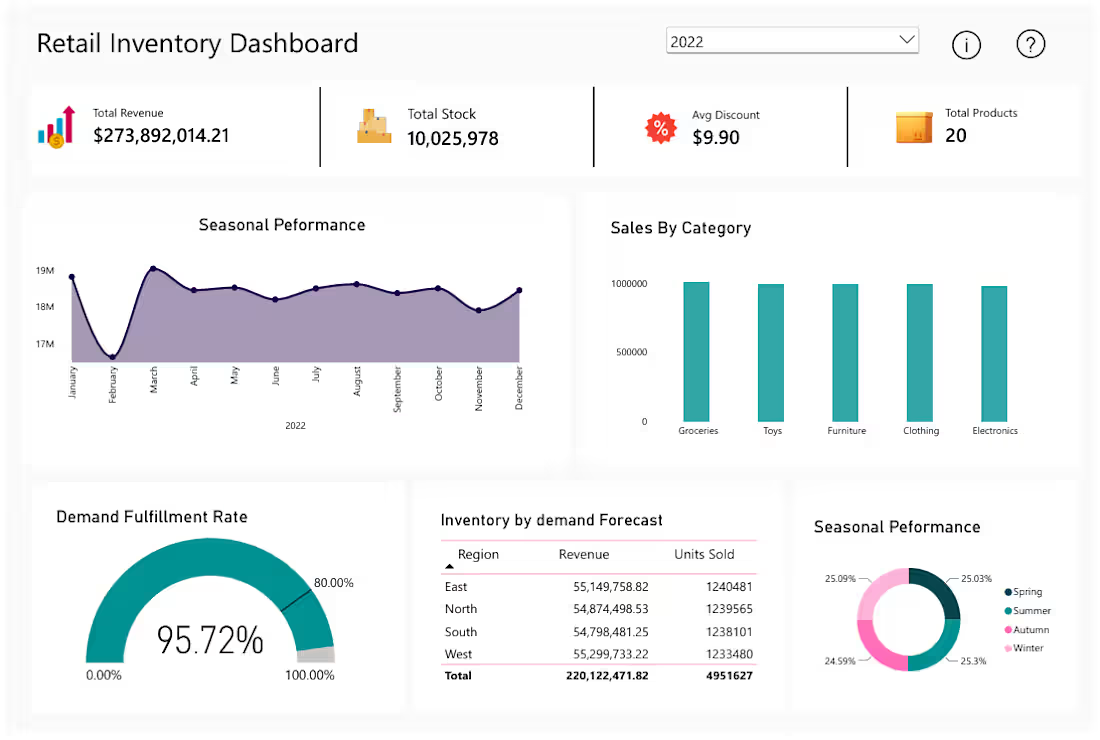
The dashboard brings together key metrics such as revenue, total stock, demand fulfillment, number of products, and average discount. It also shows sales by category, monthly trends, regional performance, inventory against demand forecasts, and seasonal patterns.
One of the key findings was a 95.72% demand fulfillment rate. The analysis also showed relatively balanced sales across the five product categories and similar performance across the four seasons. These insights help highlight sales trends and areas where inventory and demand may need closer attention.
The screenshot shows the dashboard overview, with the complete project available on GitHub.
1
246
Retail Fraud Analysis
Retail businesses need to detect fraud without unnecessarily flagging legitimate transactions. I built this project using 100,000 retail transactions to explore fraud patterns and identify where financial risk was concentrated.
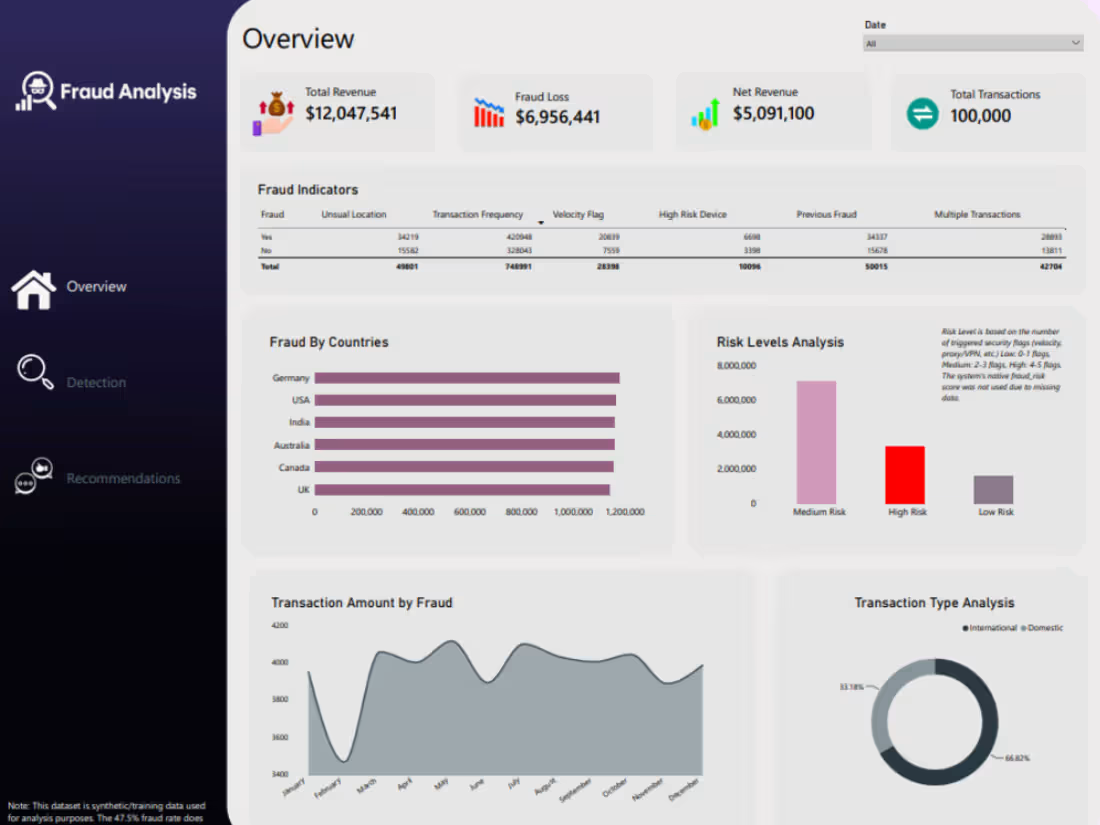
During data exploration, I found that the original fraud-risk score was stuck at 0.0 across all records, while two location fields contained duplicate information. Rather than inventing a score, I created transparent Low, Medium, and High risk classifications using available security indicators, including transaction velocity, proxy/VPN usage, and high-risk devices.
I used SQL to clean and prepare the data, then built an interactive Power BI dashboard covering the overall picture, fraud detection, and recommendations.
One key finding was that medium-risk transactions represented approximately $7.1 million in financial exposure, compared with $3.3 million for high-risk transactions. The analysis also showed that fraud activity was concentrated in lower transaction-value brackets.
The overview below shows the project, while the full analysis is available on GitHub.
1
226
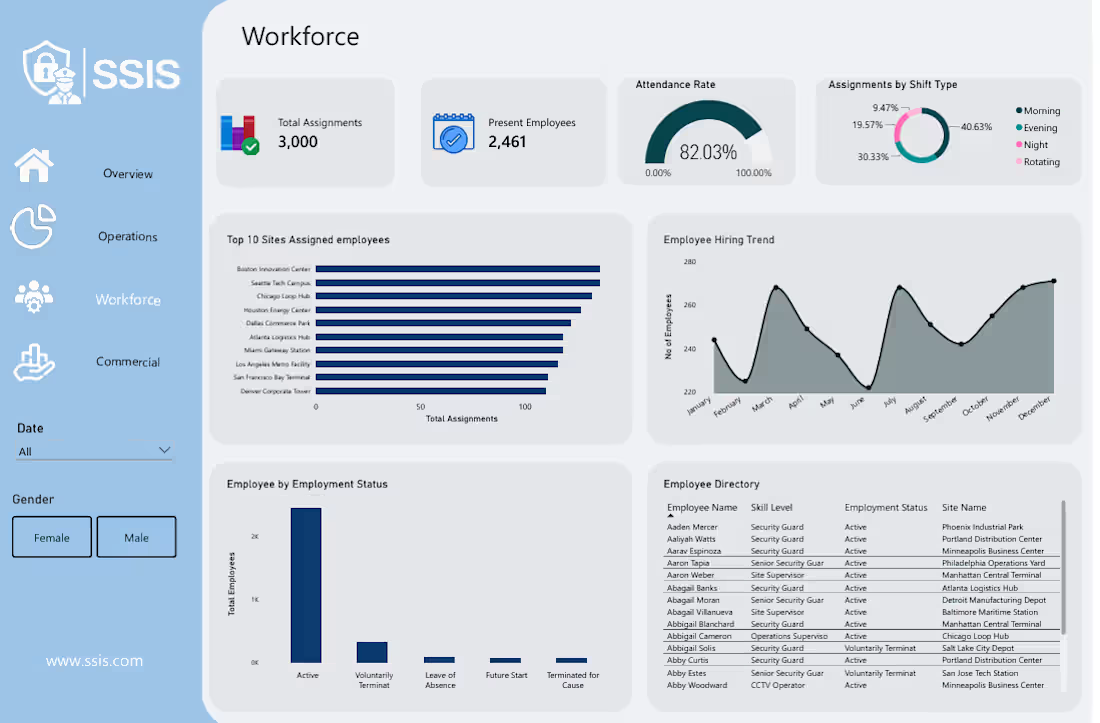
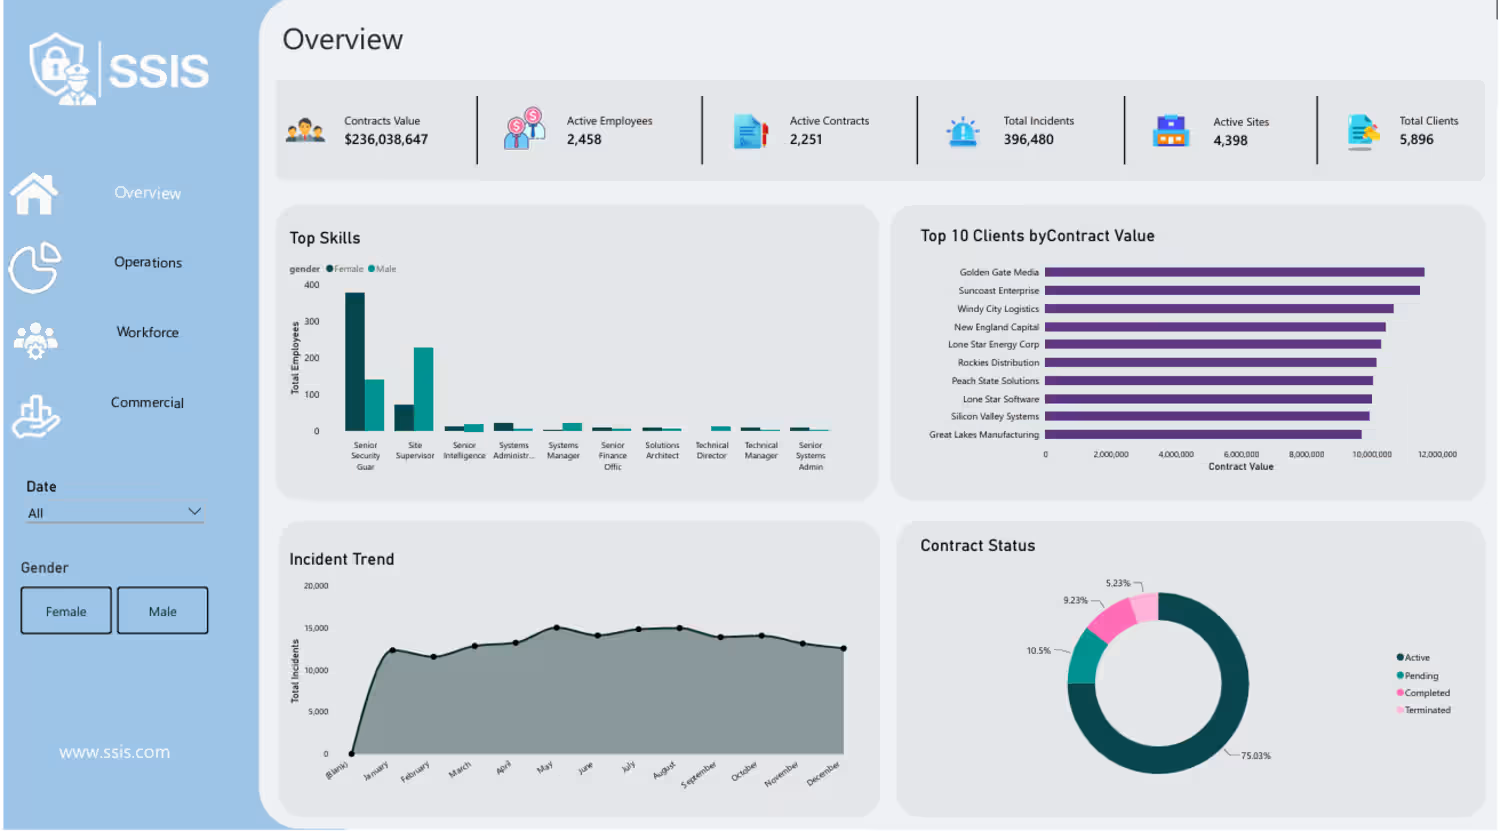
Security Support Information System
This project focuses on improving operational visibility and decision-making in the private security industry. I built an end-to-end Business Intelligence solution using Python for data cleaning and transformation, MySQL for database design and data management, and Power BI for the dashboards.
The final solution brings everything together in four dashboards: Executive Overview, Workforce Analytics, Operations Analytics, and Commercial Analytics.
1
242