The Three Layers of the Modern Data Stack
Paolo Perrone
On its own, data has no value. The modern data stack is an ecosystem of tools and technologies that empowers organizations to gather, store, process, and analyze data. This empowers data professionals to develop an array of applications from analytics and business intelligence to data science and machine learning, with the ultimate goal of converting raw data into valuable intelligence.
In our previous article of this deep-dive, we introduced the concept of the modern data stack and traced its evolution from the early days, emphasizing the differences between modern and legacy data stacks. In this next installment, we will take a closer look at each component of the data stack, discussing its specific use cases and how they all come together.
If the last article gave you valuable insights, fasten your seatbelt because this one is about to blow your mind!
The three layers of the modern data stack
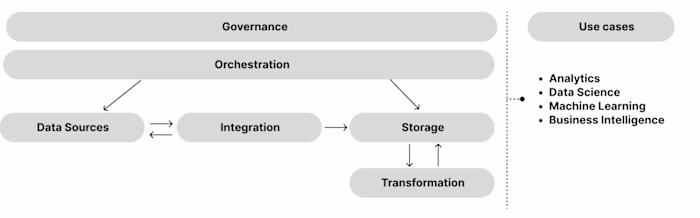
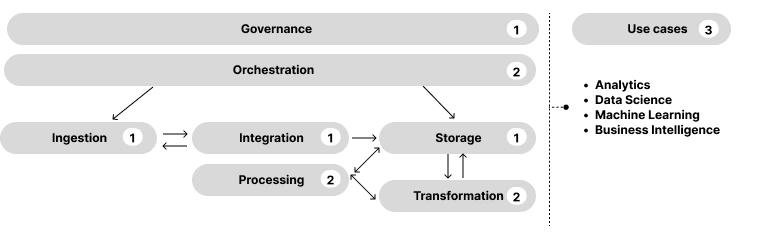
The word "stack" implies the collaboration of different components towards a shared objective. In our previous article, we identified the seven key components of governance, orchestration, ingestion, integration, processing, storage and transformation.
To gain a deeper understanding of each component and how they interact together, we are going to introduce the Three-Layer Data Stack Framework. This framework provides a structured approach to grasp the data stack's overall architecture and the sequential processes required to convert raw data into valuable insights.
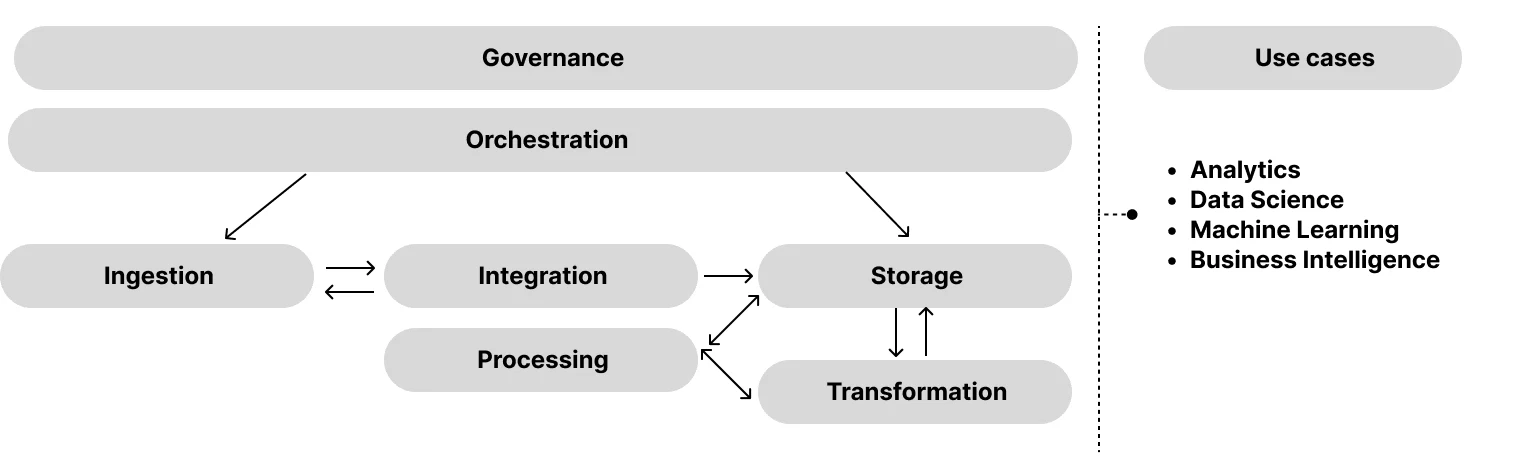
At its core, the data stack consists of three main layers: ingestion & storage, processing, and the analytics layer.
The first layer focuses on gathering raw data from various sources and storing it into the data stack. Data can come from different sources such as customer transactions, website visits, social media interactions, smartphones, CRM systems, SaaS apps and third-party data providers. Data also comes in a variety of format, such as structured, semi-structured, and unstructured, each of which requires appropriate tools and techniques for handling and storage.
Once the data is stored, it needs to be processed. This is where the processing layer comes into play. This layer involves transforming raw data into a usable format by performing tasks like data cleaning, enrichment, and transformation. These operations ensure that raw data is refined and standardized, setting the foundation for further in-depth analysis.
The analytics layer, the final piece of the puzzle, is where the magic happens. Through real-time dashboards, interactive visualizations, artificial intelligence and powerful predictive analytics, decision-makers can explore data from multiple angles and derive actionable intelligence. This is where the full potential of the data stack is realized.
The chart below maps each component of the data stack to its respective layer.
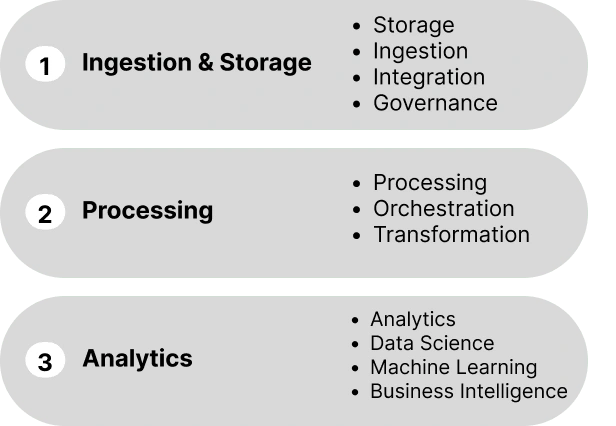
Ingestion & Storage Layer
Ingestion & Storage is the foundational layer of the data stack, responsible for managing data from its initial collection to storage. Within this layer, several important activities take place:
Governance: this phase involves establishing data governance policies and practices to ensure data quality, privacy, and compliance. It focuses on defining standards, protocols, and procedures for managing data throughout its lifecycle.
Ingestion: in this phase, data is collected and captured from various sources and systems. It involves extracting data from different platforms, such as databases, APIs, or streaming sources, and bringing it into the data stack for further processing.
Integration: this phase involves combining data from various sources into an unified format. This requires harmonizing data formats, resolving inconsistencies, and integrating the data to ensure compatibility.
Storage: once the data has been ingested and transformed, it needs to be stored for future access. This phase involves storing the processed data in suitable systems like data warehouses, data lakes, or other storage repositories, ensuring its availability and scalability.
Processing Layer
The Processing Layer focuses on transforming the raw data into a usable format for generating meaningful analysis:
Transformation: in this phase, the raw data is cleaned, organized, and structured to make it suitable for analysis. This includes tasks like data cleansing, normalization, modelling, and data enrichment. The purpose of transformation is to prepare the data for further processing and analysis by ensuring its quality, consistency, and compatibility[^1].
Processing: once the data is transformed, it enters the processing phases. Here, computations, aggregations, and calculations are performed to identify patterns, and generate meaningful output. The primary goal is to further refine and structure the data, making it suitable for in-depth analysis in the subsequent layer. Techniques such as data modeling, data validation, data enrichment, and data normalization are employed in this stage.
Orchestration: this component is responsible for coordinating and managing the diverse tasks that occur during data processing. Its primary function is to ensure the smooth flow of data and the execution of computations in a structured and synchronous manner. As such, orchestration plays a pivotal role across the three layers, facilitating the movement of data and seamless collaboration across different components of the data stack.
Analytics Layer
Finally, the Analytics Layer is where valuable insights are extracted and business intelligence is generated:
Analytics: this phase involves applying statistical analysis, data mining, and machine learning techniques to the processed data. It aims to uncover hidden patterns, correlations, and trends that provide valuable insights into the data. These insights help businesses make informed decisions and drive improvements.
Visualization: charts, dashboards and reports are created to effectively communicate the analytical findings. These visual representations provide a clear and concise way to present the data insights, making it easier for business users within the organization to understand and derive actionable insights.
Phew, take a moment to catch your breath, that was a lot of information to absorb! Understanding the intricacies of data-related discussions can be really challenging for business leaders, but we're here to bring things down-to-earth and make them manageable.
By the way, if you're looking for a final captivating graph, here's the visual representation you're already familiar with, now enhanced with the final missing piece of information: each component mapped against its respective layer.
In the next and final installment of this deep-dive, we will provide a practical mapping of commonly used tools for each component. So, take a deep breath, relax, and get ready to dive into this together!
Like this project
Posted May 22, 2023
Discover how the 3 layers of the data stack— ingestion, processing, and analytics, convert raw data into actionable intelligence. Practical mapping included 🗺
Likes
0
Views
120
Clients
Contra