Retail Store Performance Dashboard Design

Alex Spelucin

Dashboard for retail store performance
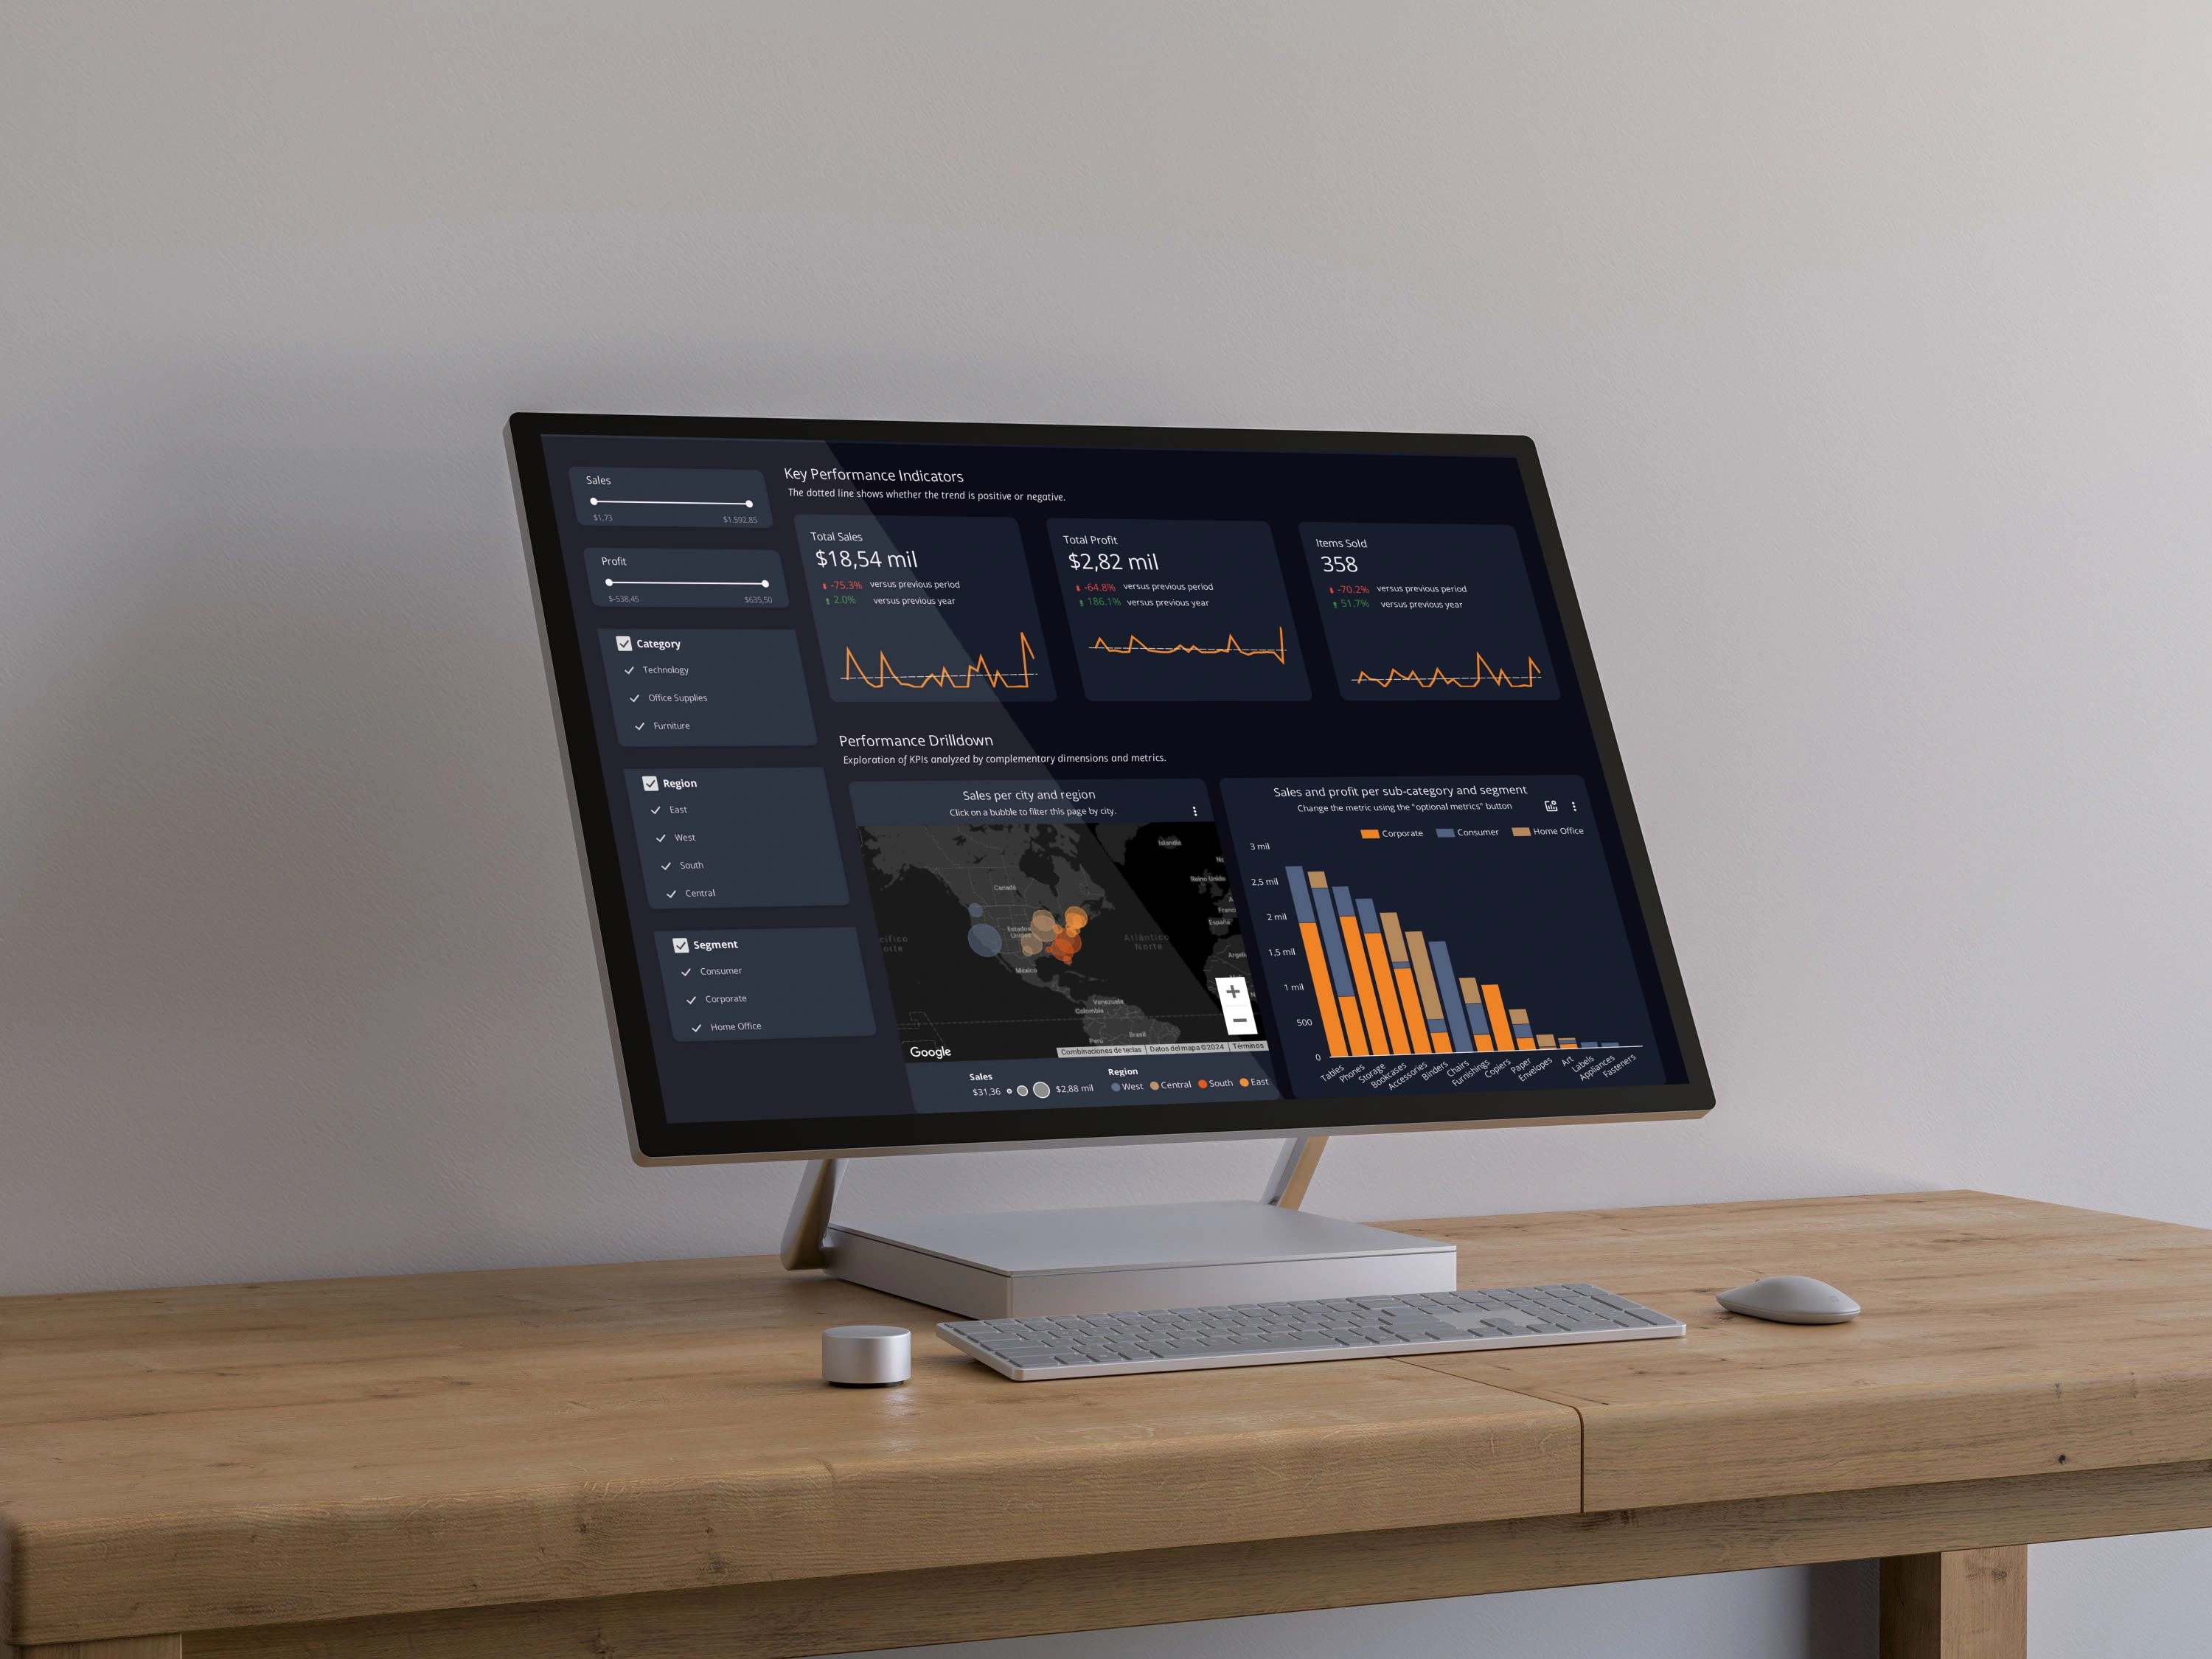
This PDF represents a snapshot of a dynamic Looker Studio dashboard I designed to provide a comprehensive overview of a fictional "Superstore's" sales performance. As you can see, it's not just a collection of charts; it's a strategic tool built to drive informed decision-making. Let me walk you through its key features and how my agency can deliver this level of insight for your clients.
Executive Overview
Key Performance Indicators (KPIs) at a Glance: The first section delivers a high-level summary. I've surfaced the most critical metrics – Total Sales, Total Profit, and Items Sold – front and center. Notice how I've included clear comparisons to both the previous period and the previous year. This context is crucial; it immediately tells the viewer the direction of the business (positive or negative trends), indicated by those insightful trend lines.
Contextual Filtering: I've incorporated a date range filter (1 ene 2016 - 31 ene 2016 in this case) and a region filter (East, West, South, Central). This interactivity, while static in the PDF, is live in the dashboard, enabling users to drill down and segment the data to answer specific questions. Imagine your clients being able to instantly see how a campaign performed in the West versus the East, or how sales trended over a specific quarter!
Clear Visual Hierarchy: The layout is meticulously designed. The KPIs are prominent, and the supporting charts flow logically. I always prioritize a clean, intuitive design so that the most important information jumps off the page (or screen).
Deeper Dive Analysis
Sales per City and Region (Geographic Visualization): Here, I've used a map to illustrate sales distribution across cities and regions. In the live dashboard, clicking on a bubble would filter the entire page, offering a powerful way to explore regional performance. This level of interactive exploration is invaluable for understanding market penetration and identifying growth opportunities. While this is a static image in the PDF, it represents the dynamic capabilities I build into dashboards.
Sales and Profit by Sub-Category and Segment (Segmented Bar Chart): This stacked bar chart breaks down sales by product sub-category (Tables, Phones, etc.) and customer segment (Corporate, Consumer, Home Office). The "optional metrics" button (mentioned in the chart title) is a Looker Studio feature I leverage to allow users to toggle between different metrics – perhaps sales value vs. profit margin – within the same chart. This maximizes space and provides flexibility. I've also incorporated a filter to focus on specific segments.
Quantity by Ship Mode (Pie Chart): The pie chart clearly visualizes the distribution of shipments by mode (Standard Class, Second Class, etc.). Again, in the interactive dashboard, clicking on a slice would filter the page, allowing for deeper analysis of each ship mode's performance. This helps optimize logistics and delivery strategies.
Average Ticket and Quantity Over Time (Dual-Axis Line Chart): This chart plots both average ticket value and quantity over time, using a dual-axis to effectively compare metrics with different scales. This is essential for understanding pricing trends and sales volume fluctuations. I've even included a helpful definition of "Average ticket" for clarity.
My Commitment:
I specialize in designing and developing these types of high-impact Looker Studio dashboards. We handle the entire process, from data connection and preparation to visualization design and user training. We're not just building dashboards; we're building data-driven cultures.
Let's schedule a call to discuss how we can transform your agency's reporting and deliver exceptional value to your clients.
Like this project
Posted Apr 19, 2025
Designed a Looker Studio dashboard for Superstore's sales performance analysis.
Likes
0
Views
0
Timeline
Dec 31, 2015 - Jan 30, 2016


London Crime Rates Dashboard Design
Looker Studio Dashboard for Marketing Performance