Looker Studio Dashboard for Marketing Performance

Alex Spelucin


Dashboard system for Growth Marketing Agency
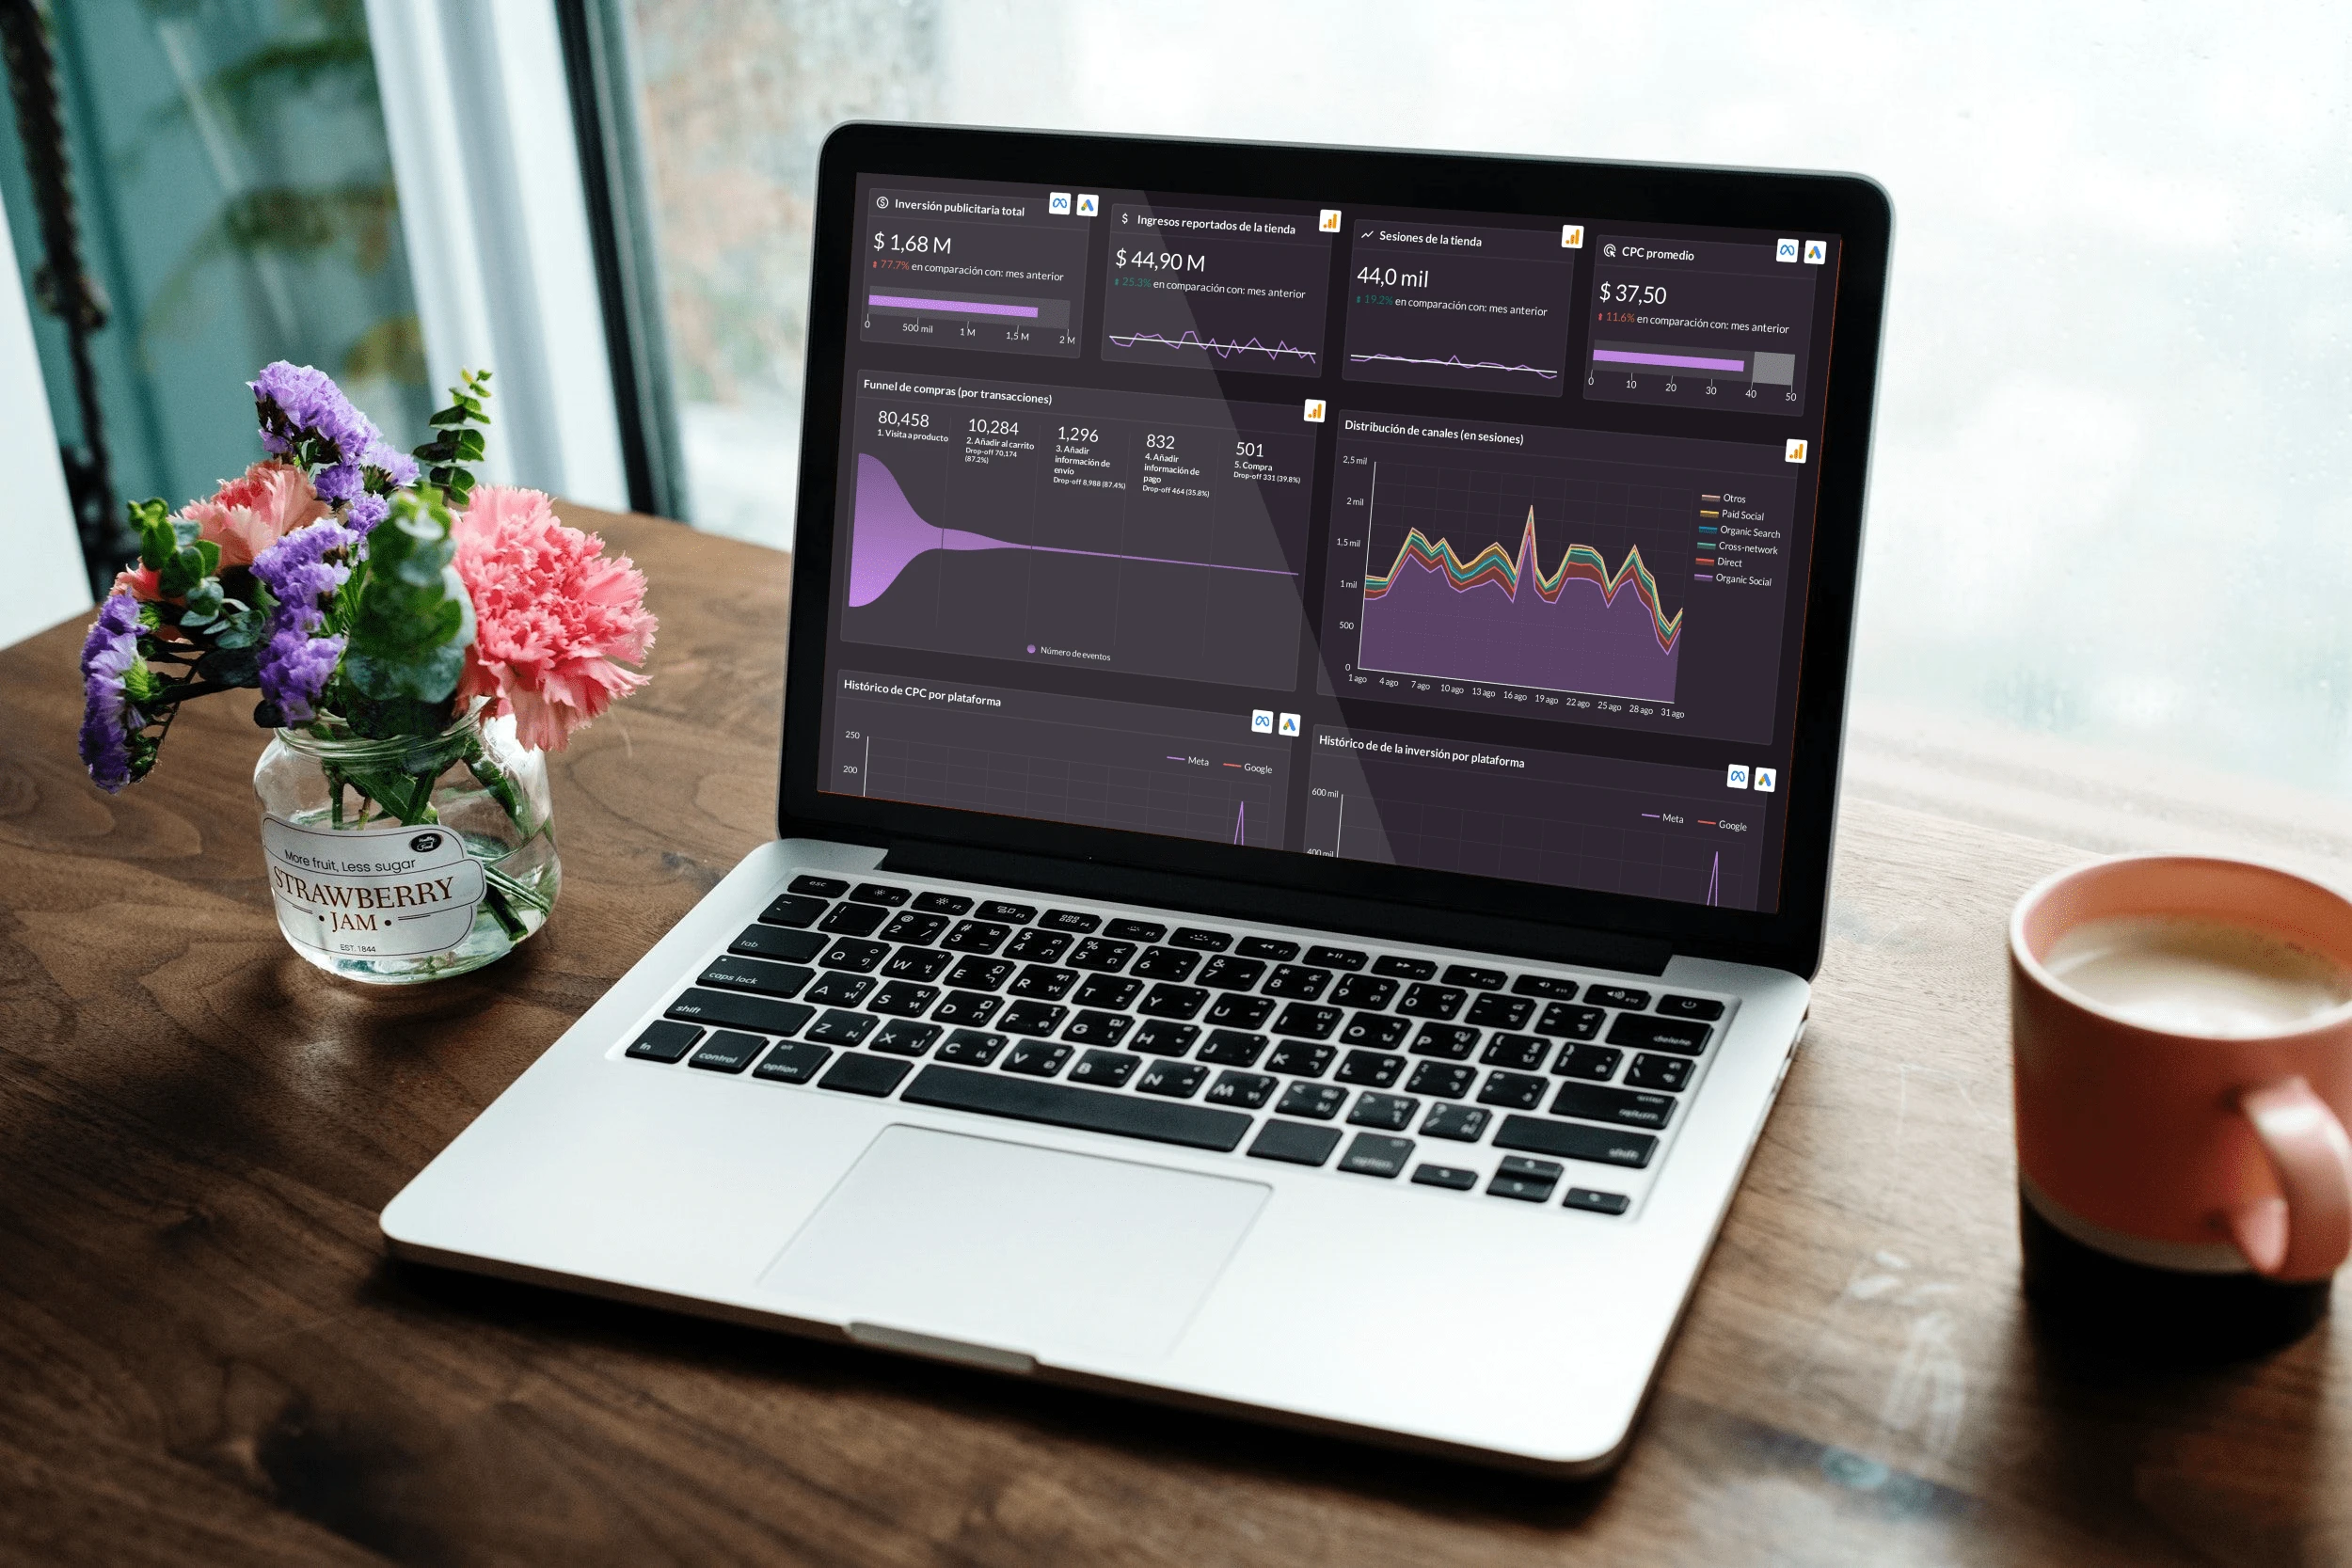
This PDF represents a comprehensive marketing performance report for "Llovizna Ropa de Bebé," generated from a Looker Studio dashboard I've designed. It provides a deep dive into key metrics, channel performance, and campaign effectiveness. It's more than just data; it's a roadmap for optimizing marketing spend and driving sales. Let's explore its features and how my agency can empower your clients with similar data-driven strategies.
Overall Performance Summary
Executive-Level KPIs: The report begins with a high-level overview, presenting essential metrics like total advertising investment ($1.68M), reported store revenue ($44.90M), store sessions (44.0k), and average CPC ($37.50). Crucially, I've included percentage comparisons to the previous month, providing immediate context on performance trends. This allows for quick identification of growth areas and potential concerns.
E-commerce Funnel Analysis: A detailed shopping funnel visualization breaks down the customer journey, from product visits to completed purchases. Drop-off rates at each stage are clearly presented, highlighting areas where potential customers are abandoning the process. For example, a significant drop-off between "Visit to product" and "Add to cart" (87.2%) suggests issues with product page content or user experience.
Channel Distribution: The "Distribution of channels" chart illustrates the sources of store sessions, categorizing them into channels like Paid Social, Organic Search, and Direct. This allows for an understanding of which channels are driving the most traffic.
Advertising Investment Trends: A time-series chart tracks advertising investment across platforms like Meta and Google, providing insight into spending patterns over the month.
Advertising Performance Summary
Key Advertising Metrics: This page focuses on advertising performance, summarizing total advertising investment, total billings, ROAS (Return on Ad Spend), and CPC. Again, month-over-month comparisons offer valuable context.
Platform-Specific Trends: Time-series charts visualize trends in billings, ROAS, and CPC for Google and Meta separately. This allows for a side-by-side comparison of platform performance and helps in optimizing budget allocation.
Cost Per Conversion Analysis: A chart specifically tracks the cost per conversion for each platform, which is critical for understanding the efficiency of advertising spend.
Meta Ads Performance
In-Depth Platform Analysis: This page drills down into Meta Ads performance, providing metrics on advertising investment, platform billings, and ROAS.
Investment vs. Billings: A chart compares advertising investment with platform billings, helping to understand spending versus cost.
Click and Impression Analysis: Charts track click-through rate (CTR), impressions, and clicks, offering insights into ad visibility and engagement.
Meta Ads Campaign Performance
Campaign Performance Ranking: Tables showcase the top-performing campaigns based on ROAS and overall billing and investment, enabling identification of successful strategies and areas for optimization.
Ad Performance Details: A table provides a detailed breakdown of individual ad performance, including thumbnail, URL, impressions, clicks, CTR, investment, billings, CPC, and ROAS. This granular data is essential for ad creative analysis and refinement.
Google Ads Performance
Google Ads Metrics: Similar to Page 3, this page focuses on Google Ads, with charts displaying investment vs. billings, cost per conversion, and ad visibility metrics.
Performance Max Campaigns: The report includes specific data on Performance Max campaigns, highlighting their investment and ROAS.
Google Ads Campaign and Keyword Analysis
Campaign Performance: A table provides key metrics for Google Ads campaigns, including ROAS, billings, investment, and conversions.
Keyword Performance: A detailed keyword performance table shows impressions, clicks, and CTR for specific search terms, offering insights into search query effectiveness.
E-commerce Channel Analysis
Channel Performance: This page analyzes e-commerce performance by channel, showing session share, transaction share, and revenue share for various channels.
Device Usage: The report also breaks down sessions by device (mobile, desktop, tablet).
Conversion and Buyer Rates: Charts display conversion rates and buyer rates by channel, revealing which channels are most effective at driving sales.
E-commerce Funnel Deep Dive
Funnel Breakdown: This page provides a more detailed breakdown of the e-commerce funnel, showing the number of users and transactions at each stage, along with drop-off rates. Funnel analysis is provided separately for desktop and mobile.
Product Performance
Product Category Analysis: Charts show the number of items purchased and revenue generated by product category.
Individual Product Performance: A table lists individual product performance, including views, adds to cart, purchases, and revenue.
My Agency's Value Proposition:
My agency specializes in building these powerful Looker Studio dashboards. We handle data connection, visualization, and training, empowering businesses to unlock the full potential of their data. Let's talk about how we can transform your clients' data into a strategic advantage.
Like this project
Posted Apr 19, 2025
Designed a Looker Studio dashboard for marketing performance analysis.


Retail Store Performance Dashboard Design
London Crime Rates Dashboard Design