
Amul Sales Dashboard | Excel by Aayushi KanthaliAmul Sales Dashboard | Excel by Aayushi Kanthali
Amul Sales Dashboard | Excel Data Analysis & Visualization
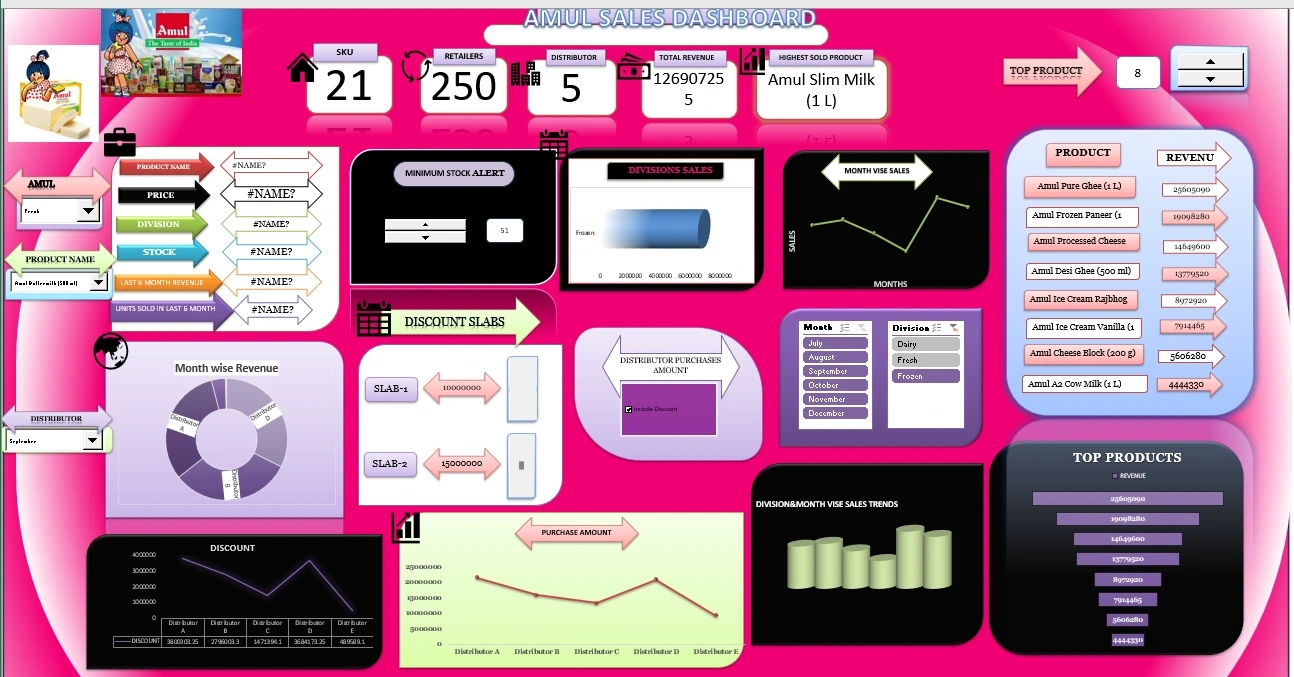
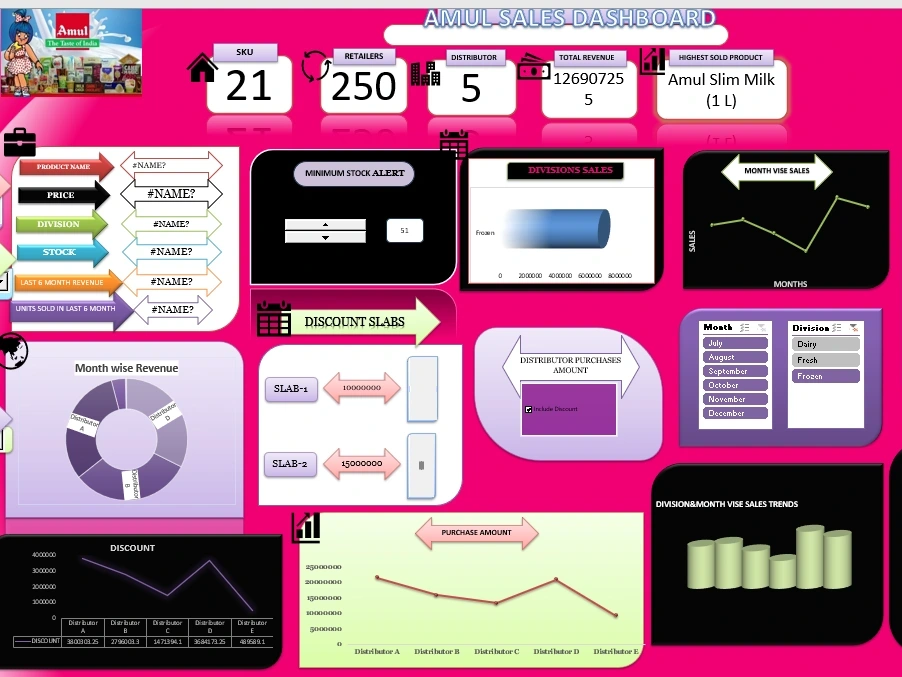
I created this interactive Amul Sales Dashboard in Microsoft Excel to analyze sales performance and convert raw sales data into clear, actionable insights.
What I worked on:
Cleaned and organized sales data for accurate analysis
Analyzed sales, revenue, retailers, distributors, products and monthly performance
Created interactive charts, graphs and KPI cards
Used Excel-based data analysis to identify top-performing products and sales trends
Designed a user-friendly dashboard for quick business insights
Highlighted important metrics such as total revenue, retailers, distributors, sales trends and product performance
Skills demonstrated:
Data Entry | Data Cleaning | Microsoft Excel | Data Analysis | Dashboard Creation | Charts & Visualization | Pivot Tables | Business Reporting
This project demonstrates my ability to take raw/structured data and turn it into a clean, visually appealing dashboard that makes business information easier to understand and use for decision-making.
Amul Sales Dashboard | Excel Data Analysis & Visualization I created this interactive Amul Sales Dashboard in Microsoft Excel to analyze sales performance an...
0 likes · 0 views · Nov 11, 2026
Interactive Amul Sales Dashboard built in Microsoft Excel to analyze sales, visualize KPIs and deliver actionable business insights.

