World alcohol consumption Dashboard
Clément Charlemagne
📊 During the holidays, I created, on a whim, a dashboard in Power BI using a dataset available on Kaggle. It contains data on population consumption, categorized by gender, country, and date.
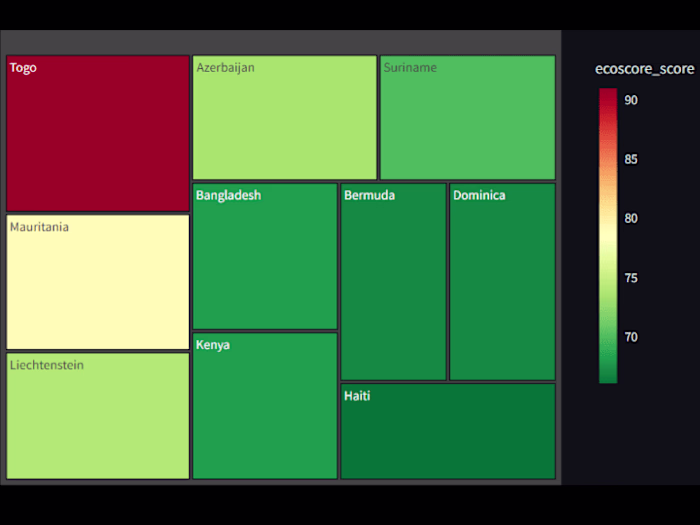
📁 The dataset, which is quite small and simple, did not allow for in-depth analysis. However, I enriched the data by scraping to add a new parameter: the population of each country included in the dataset. This allowed me to create a 🌍 world map displaying the countries with the highest alcohol consumption proportionally to their population.
✅ In the end, this dashboard offers:
The ability to search for a country using a search bar to display daily alcohol consumption by gender.🔍
The option to explore data by clicking on a country in the table or directly on the world map.🌟
Like this project
Posted Jan 28, 2025
📊 During the holidays, I created, on a whim, a dashboard in Power BI using a dataset available on Kaggle. It contains data on population consumption, categoriz
Likes
0
Views
7