Bottom left hero backgroundTop right hero background

Best German-speaking freelance Data Visualizers to hire in 2025

Looking to hire German-speaking Data Visualizers for your next project? Browse the world’s best freelance Data Visualizers on Contra.

Trusted by 50K+ teams from creative agencies to high growth tech companies

Logo for Wix StudioLogo for RiveLogo for WebstudioLogo for GlorifyLogo for JitterLogo for FlutterFlowLogo for PeachWebLogo for CanvaLogo for Lottie FilesLogo for Workshop BuiltLogo for BuildshipLogo for AppsumoLogo for FramerLogo for BarrelLogo for BubbleLogo for LummiLogo for WebflowLogo for GrayscaleLogo for Stride UXLogo for InstantLogo for SplineLogo for KittlLogo for RelumeLogo for HeyGenLogo for Replo
FAQs

How can I clearly explain my project needs to a data visualizer?

To make sure a data visualizer knows what you need, use simple and clear words to describe your project. Share details about the data you have and what you want it to show. It helps if you give examples or sketches of the style you like. Good communication at the start helps the project run smoothly.

What should I include in the project timeline for a data visualization project?

First, think about when you need the project finished by. Then, plan for different parts like data analysis, design drafts, and revisions. Communicate these steps with the data visualizer to make sure everyone understands the timing. A clear timeline helps keep the project on track.

How important is it to discuss the data source with a freelance data visualizer?

It’s very important to talk about the data source right at the beginning. Make sure the data is ready and easy for the data visualizer to use. The freelance data visualizer needs to know about the format, size, and quality of your data. This helps them plan the best way to create your visuals.

What details should I provide in the project brief for a data visualization project?

A project brief should include the main goals of your project and who will see the final visuals. Tell what story you want the data to tell. Include any preferences for style, color, or design. This helps the data visualizer create a product that fits your vision.

How do I ensure the freelance data visualizer has access to necessary tools and data?

Make sure all permissions and access rights to your data are set up before the project starts. Confirm if the data visualizer needs specific software or tools. Share any relevant files and documents securely. This way, the data visualizer can work efficiently without delays.

Why is it vital to agree on feedback and revision timelines with the data visualizer?

Agreeing on feedback and revisions helps avoid confusion later. Decide how many rounds of revisions are okay and how long each one will take. This helps both you and the data visualizer know what to expect. Clear plans help keep the project moving forward smoothly.

What should I consider ensuring clear communication throughout the project?

Setting up regular check-ins helps both you and the data visualizer stay on the same page. Choose a communication tool that both of you are comfortable with. Be open about any questions or changes during the project. Good communication means fewer surprises and a better final product.

What can I do to support the data visualizer in understanding my business goals?

Share insights about your business and what makes it unique. Explain how you want the data visualizations to help with business decisions. Offering this context helps the data visualizer tailor their work to best fit your needs. This leads to visuals that truly support your goals.

How should I set expectations for the final deliverables with the freelance data visualizer?

Clearly list what you expect in the final deliverables. Discuss the file formats, quality, and how the visuals will be used. Make sure the data visualizer knows any specific requirements. Setting clear expectations ensures you receive what you need at the end of the project.

What role does discussing style preferences play in hiring a freelance data visualizer?

Discussing style preferences ensures the visuals align with your brand and vision. Share examples of styles you like or show the data visualizer your brand guidelines. This conversation helps the data visualizer understand your taste. It leads to a product that matches your expectations and audience.

Who is Contra for?

Contra is designed for both freelancers (referred to as "independents") and clients. Freelancers can showcase their work, connect with clients, and manage projects commission-free. Clients can discover and hire top freelance talent for their projects.

What is the vision of Contra?

Contra aims to revolutionize the world of work by providing an all-in-one platform that empowers freelancers and clients to connect and collaborate seamlessly, eliminating traditional barriers and commission fees.

Profile avatar
Pixel One
PROMiami, USA
$10k+
Earned
8x
Hired
5.0
Rating
4
Followers
FRAMER_EXPERT

Expert

Cover image for B2B SaaS Developer Tool Website Redesign
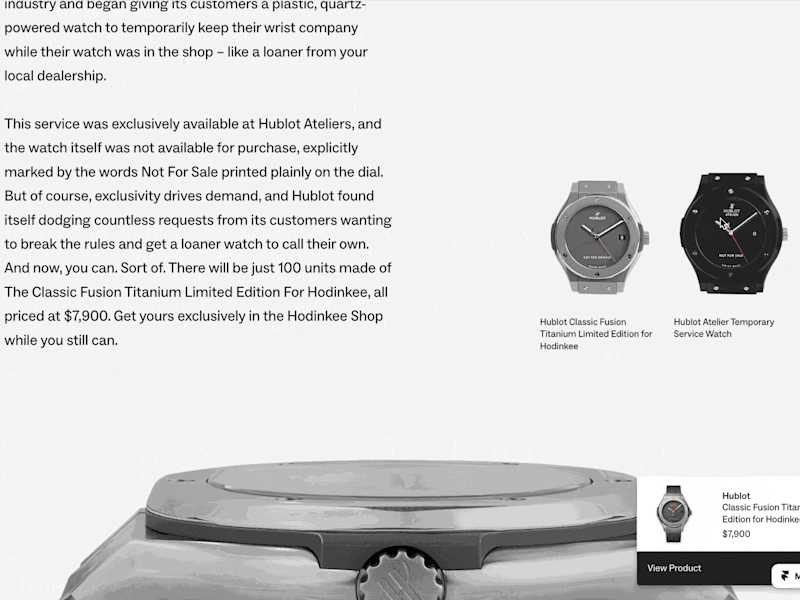
Cover image for Luxury Retail Website to Showcase a Limited Edition Product
Cover image for B2B SaaS in EdTech Rebrand and Marketing Website Design
Cover image for Dietitian platform that connects providers with customers
Profile avatar
Subhradip Roy
India
1x
Hired
5.0
Rating
3
Followers
Cover image for Clearbook : AI powered Application to Automate Data Analytics
Cover image for 3D Pose Estimation: Motion Analysis through Computer Vision
Cover image for Cinematic AI Video
Cover image for AI-Crafted Cinematic and Sports Posters : Visual Storytelling
Profile avatar
Arnaldo Matute
PROColombia
$1k+
Earned
2x
Hired
5.0
Rating
1
Followers
Cover image for Contents creation for training and concept delivery
Cover image for Coursera: Data Analytics for Lean Six Sigma
Cover image for Optimal UPS Deployment with Gurobipy
Cover image for Nuclear And Carbon
Profile avatar
Léon Sharon Geisler
PRO33790 Halle, Germany
Cover image for Market Research YoungBrandAwards
Cover image for Employee surveys Museum for russian german cultural history
Cover image for Employee Survey Analysis Project
Cover image for Statistical Analysis for Academic Research
Profile avatar
Manuel Navarro
PROSanta Cruz de Tenerife, Spain
$5k+
Earned
7x
Hired
5.0
Rating
6
Followers
Cover image for BigQuery Database Creation and Automation
Cover image for Google Sheets Migration and Visualization
Cover image for Sales Report Dashboard on Power BI
Cover image for AI Chatbot for e-commerce

People also hire

Explore projects by German-speaking Data Visualizers on Contra

Cover image for Collaborative magic lens graph exploration
0
40
Cover image for Joker: The Movie Magazine
0
14
Cover image for B2B SaaS Product that Helps You Train an AI Model
0
63
Cover image for Energetic Overview EMENA Region
1
50
Cover image for Nuclear And Carbon
0
26
Cover image for Data Analyst and Actuary
0
4
Cover image for Data Analyst and Actuary
0
8
Cover image for tauseefhashmi/DataEngineeringPipeline
0
16
Cover image for tauseefhashmi/DataEngineeringKafkaPipelineStocks
0
18
Cover image for Smartphone addiction among university students
0
3
Cover image for Data Analysis by applying man whitney's test
0
15
Cover image for Data Science Case Study : Decoding Mr. Beast's Entire Business
0
76
Cover image for Exploratory Analysis of Geolocational Data
0
45
Cover image for 3D Pose Estimation: Motion Analysis through Computer Vision
0
42
Cover image for Excel Bike Sales Dashboard
0
3
Cover image for COVID19 Deep Analysis
0
3
Cover image for Transform Your Data with Expert Power BI Dashboards: Free Demo
0
26
Cover image for Power BI Mastery: One-On-One Training for Data Analysis 🚀
0
8
Cover image for Live Power BI Consulting: Guaranteed Results With Expert
0
10
Cover image for NetSuite Deloitte Customisation
0
3
Cover image for GA4 Migration
0
2
Cover image for Integrated SharePoint Hub with Microsoft Tools Integration
0
0
Cover image for Interactive Sales Dashboard Using Power BI
0
2
Cover image for Spotify Data Analysis
0
0
Cover image for Shark Tank series
0
1
Cover image for London Bike Rides
0
0
Cover image for Proprietary Branch Locator - Dashboard
0
0
Cover image for Spotify Dashboard
0
1
Cover image for Airbnb in Boston - Dashboard
0
1
Cover image for Cabs in NYC - Dashboard
0
1
Cover image for R Shiny App Visualizing Probability Distributions
0
1
Cover image for CLI Postgres Tool Written in Python
0
0
Cover image for Taxi Fare Amount and Generous Customer Prediction
0
1
Cover image for Real Estate Investing Dashboard
0
9
Cover image for Sonnen | Scrum Master & Agile Coach
0
3
Cover image for Dashboard Migration
0
8
Cover image for Google Data Pipeline
0
5
Cover image for Motion, University Research Project
0
2
Cover image for Market Research YoungBrandAwards
0
5
Cover image for Employee Survey Analysis Project
0
3
Cover image for Employee surveys Museum for russian german cultural history
0
3
Cover image for Sales Report Dashboard on Power BI
1
88
Cover image for CNRS Data Analyst
0
3
Cover image for Virtual Sensor Dassault Aviation
0
2
Cover image for Night Detection Dassault Aviaiton
0
1
Cover image for World alcohol consumption Dashboard
0
2
Cover image for Debt sustainability analysis, worldwide 1950–2021.
0
0
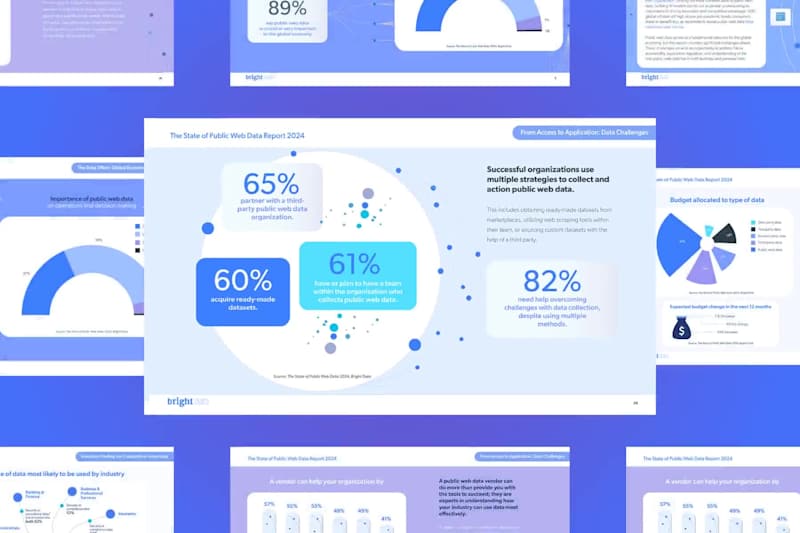
Cover image for Data Visualisation For Bright Data
1
12

Top services from German-speaking Data Visualizers on Contra

Top locations for German-speaking Data Visualizers

Join 50k+ companies and 1M+ independents

Contra Logo

© 2025 Contra.Work Inc