Sales & Profit Analytics | Interactive Excel Dashboard

Sipten Raja


Sales & Profit Analytics — Excel Dashboard
Self-Initiated Portfolio Project | Excel Analytics & Business Reporting
Project Overview
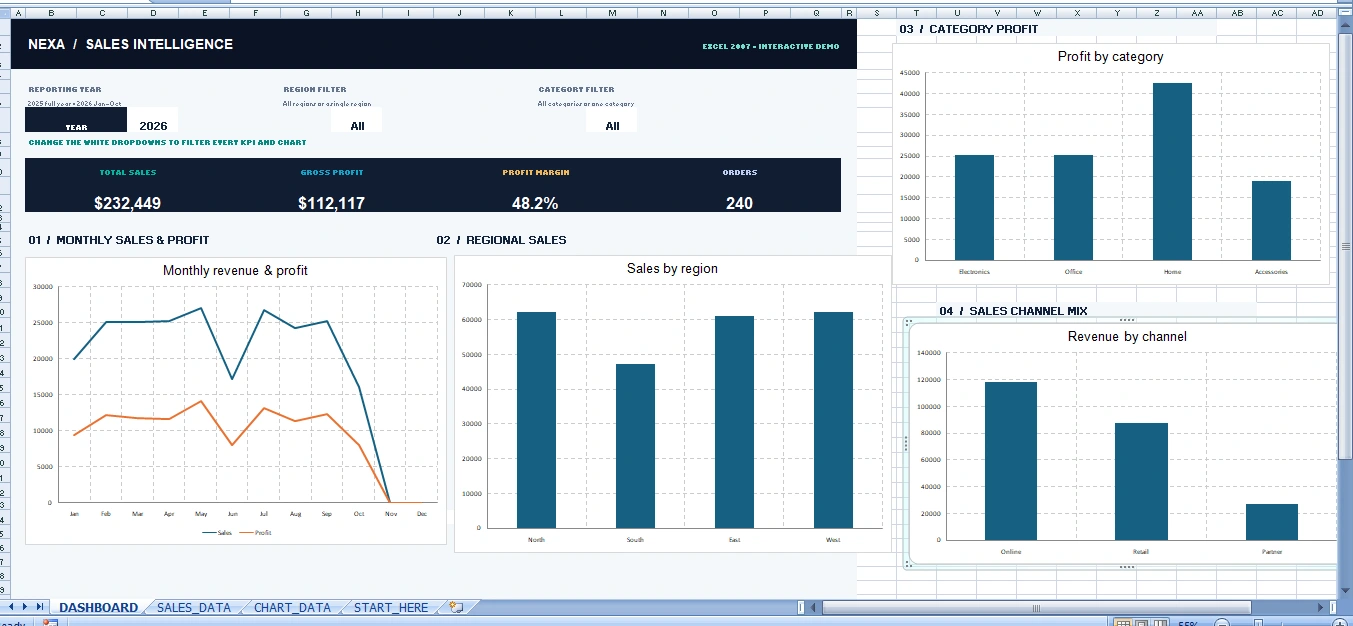
A professional Excel dashboard designed to help businesses analyze sales performance, monitor profitability, and explore key business metrics through an organized reporting interface.
Key Features
Sales and profit KPI tracking
Interactive Year, Region, and Category filters
Monthly sales performance charts
Regional and category-wise analysis
Formula-driven dashboard calculations
Excel 2007-compatible workbook
Business Value
This dashboard demonstrates how structured sales data can be transformed into clear, interactive reports that support business analysis and decision-making.
Tools: Microsoft Excel, Excel Formulas, Charts & Data Validation
Project Type: Independent portfolio demonstration using synthetic sample data.
Like this project
Posted Oct 28, 2026
Interactive Excel dashboard for sales, profit, and KPI analysis with dynamic filters, visual reports, and Excel 2007-compatible features.