Banex Cycles Dashboard Report

Mohammad Rashid


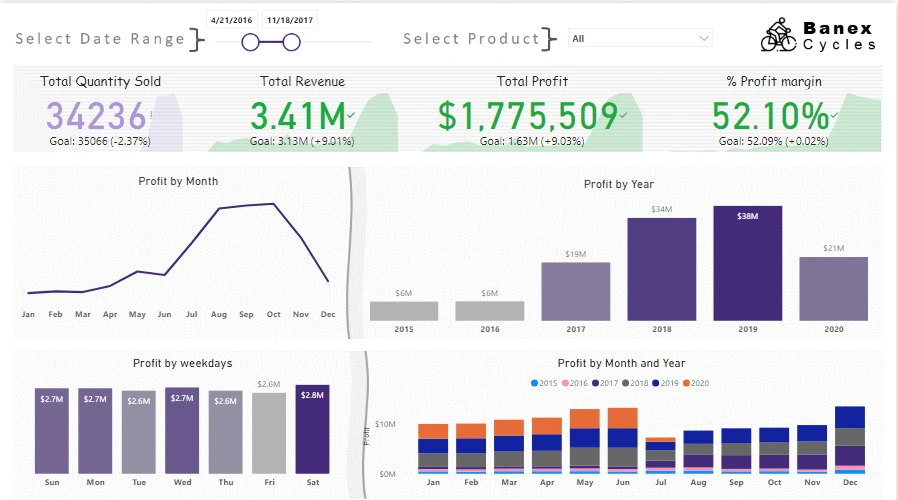
The Banex Cycles Dashboard provides a comprehensive view of sales performance, empowering stakeholders with actionable insights to drive growth and optimize strategies. On the first page, users can analyze sales across different continents in comparison to set targets, exploring key metrics such as total quantity sold, revenue, profit, and profit margin for a specified date range. Through slicers, users can customize the analysis based on date range and top products, gaining valuable insights into continent-wise performance and product contributions. The second page focuses on analyzing sales trends over time, allowing users to delve into temporal patterns and product-specific performance. With insights into sales quantity, revenue, profit, and profit margin over different date ranges, months, years, and weekdays, stakeholders can make informed decisions to maximize profitability and identify growth opportunities. Overall, the Banex Cycles Dashboard serves as a powerful tool for driving business decisions and optimizing sales strategies.
Like this project
Posted Mar 3, 2024
Banex Cycles Dashboard offers actionable insights on sales performance & trends, empowering strategic decisions for growth optimization.


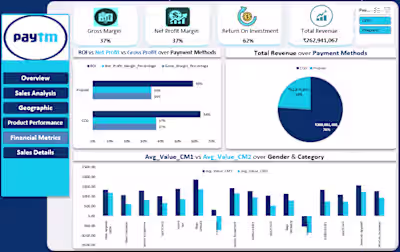
Paytm Epurchase Dashboard Report - Ecommerce Analytics
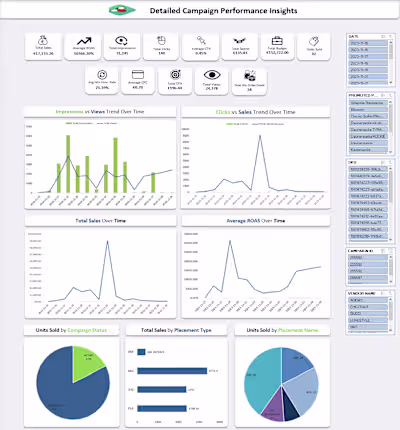
Detailed Ads Campaign Insights Report
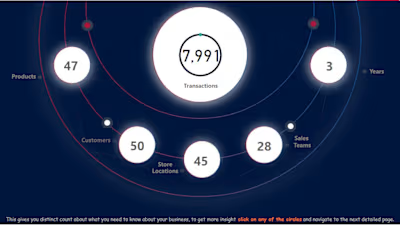
Regional Sales Multi-page Dashboard Report