Systemx Dashboard: Data-Driven Insights and Performance Tracking
Muhammad Tayyab
Systemx Dashboard: Data-Driven Business Insights and Performance Tracking
I approached the design of this dashboard to create an intuitive, data-rich interface that empowers users to monitor key business metrics, manage tasks, and stay informed about sales activities, all in one cohesive view. Here’s how I designed it step by step:
User Research :
The target audience includes business managers, sales teams, and marketing professionals who need quick access to performance metrics and task management tools.
Key insights revealed the need for clear, actionable data visualization, personalized notifications, and seamless navigation.
Information Architecture :
The dashboard is divided into three main sections:
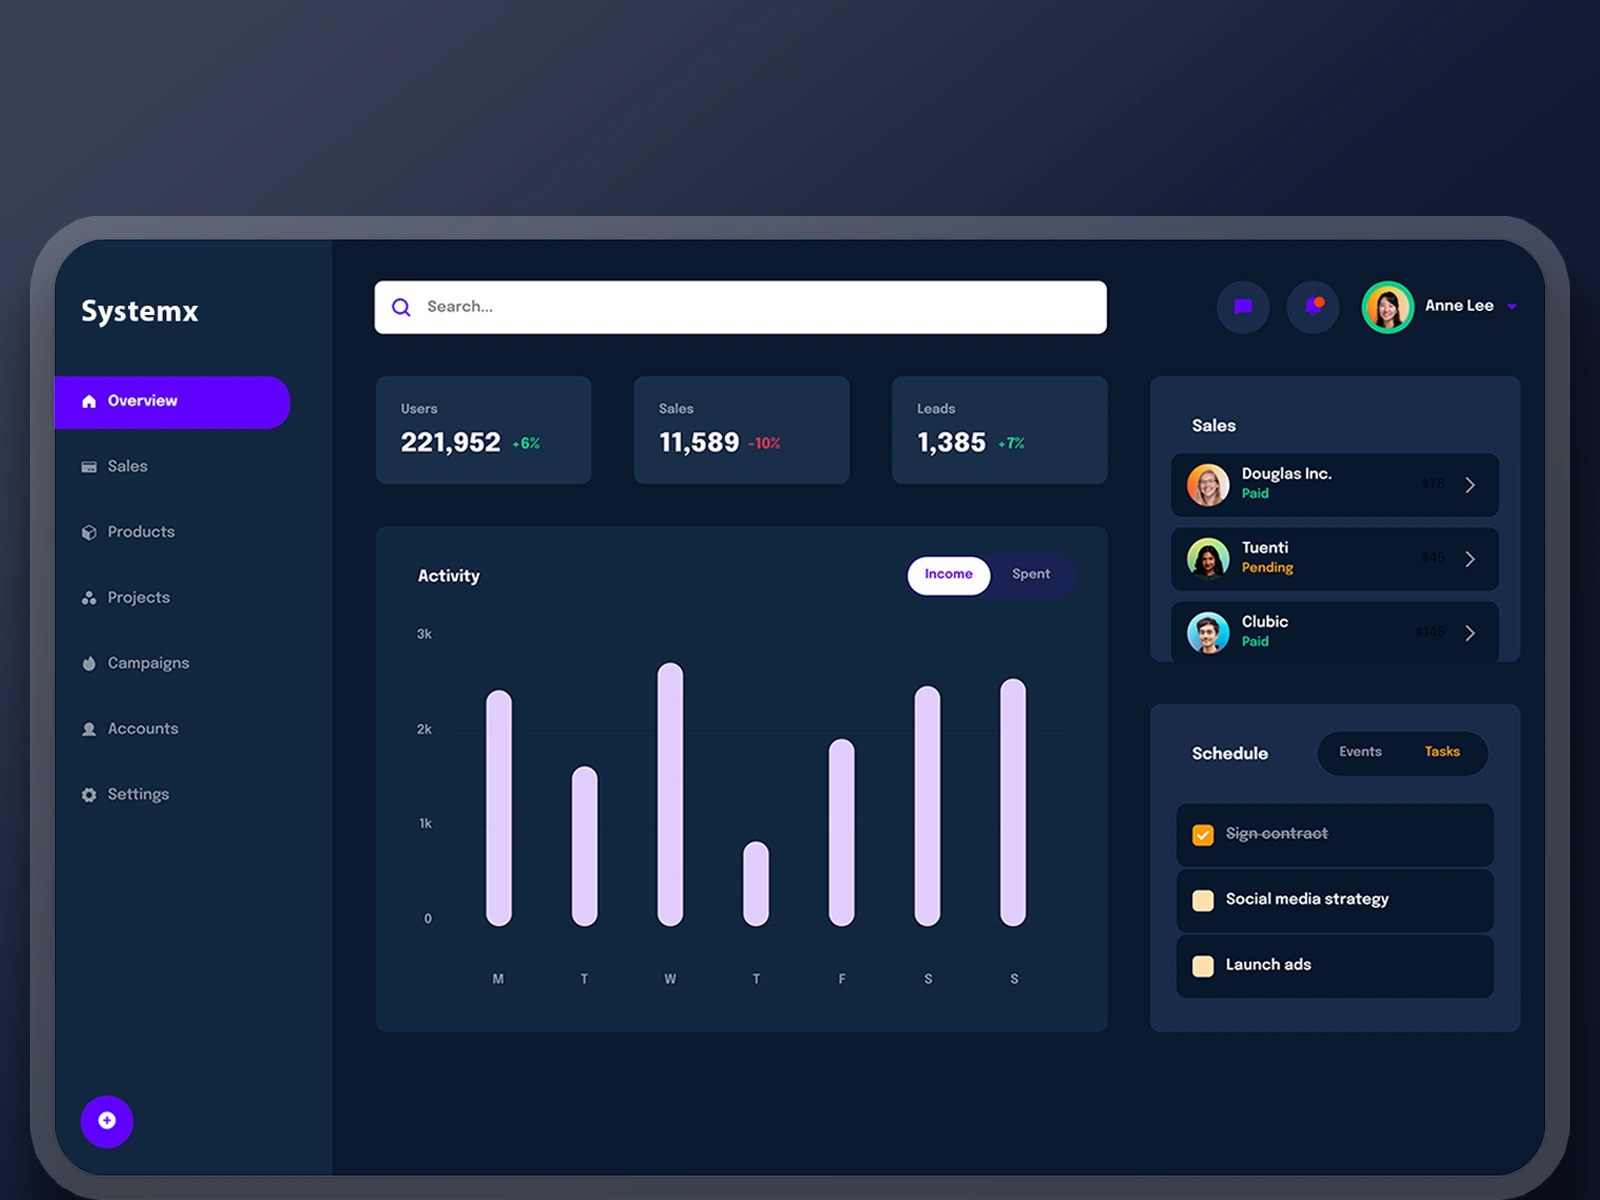
Left Sidebar : Navigation menu with categories like Overview, Sales, Products, Projects, Campaigns, Accounts, and Settings. This ensures easy access to different areas of the app.
Main Content Area : Displays critical KPIs (Users, Sales, Leads) and an activity chart for income vs. spent, providing at-a-glance insights.
Right Sidebar : Shows recent sales activity, upcoming events, and task management, keeping users updated on important actions.
Visual Design :
Color Palette : Used a dark mode theme with shades of blue and purple to create a professional and modern look. Bright accents (like purple for active tabs and white for text) ensure high contrast and readability.
Typography : Chose clean, sans-serif fonts for clarity and consistency across all elements.
Icons and Imagery : Included simple, recognizable icons for each section (e.g., house for Overview, shopping cart for Sales) to enhance usability.
Interactive Elements :
Search Bar : Positioned prominently at the top for quick filtering and searching within the app.
KPI Cards : Designed cards for Users, Sales, and Leads with percentage changes to highlight trends and performance.
Activity Chart : Implemented an interactive bar chart showing weekly income vs. spent, allowing users to toggle between views for deeper analysis.
Task Management : Added checkboxes and status indicators (e.g., paid, pending) for sales and tasks to provide clear visual cues about progress.
Usability :
Navigation : Kept the sidebar fixed for easy access to different sections without disrupting the main content.
Personalization : Included user profile details (avatar and name) in the top-right corner for a personalized experience.
Responsiveness : Ensured the layout adapts well to different screen sizes, maintaining readability and functionality.
Data Visualization :
Metrics Clarity : Displayed key numbers (e.g., 221,952 Users, 11,589 Sales) in large, bold fonts with percentage changes to quickly convey performance.
Bar Chart : Used vertical bars to represent weekly activity, making it easy to compare days and identify trends.
Sales Activity : Showcased recent transactions with client avatars, names, and statuses to keep users informed about ongoing deals.
Accessibility :
Ensured sufficient contrast between text and background for readability.
Used clear labels and tooltips where necessary to assist users in understanding complex data or features.
Feedback Loop :
Included hover effects on buttons and interactive elements to provide visual feedback.
Used color coding (e.g., green for completed tasks, orange for pending) to guide users’ attention to important actions.
By focusing on clarity, interactivity, and personalization, this design aims to empower users with the tools they need to make informed decisions and manage their business efficiently. The combination of clean visuals, intuitive navigation, and actionable data ensures a seamless and productive user experience.
Like this project
Posted Jun 8, 2025
Designed a data-rich dashboard for business insights and performance tracking.