Prism — Computer Vision Dashboard (AI)

Andrei Gurgel

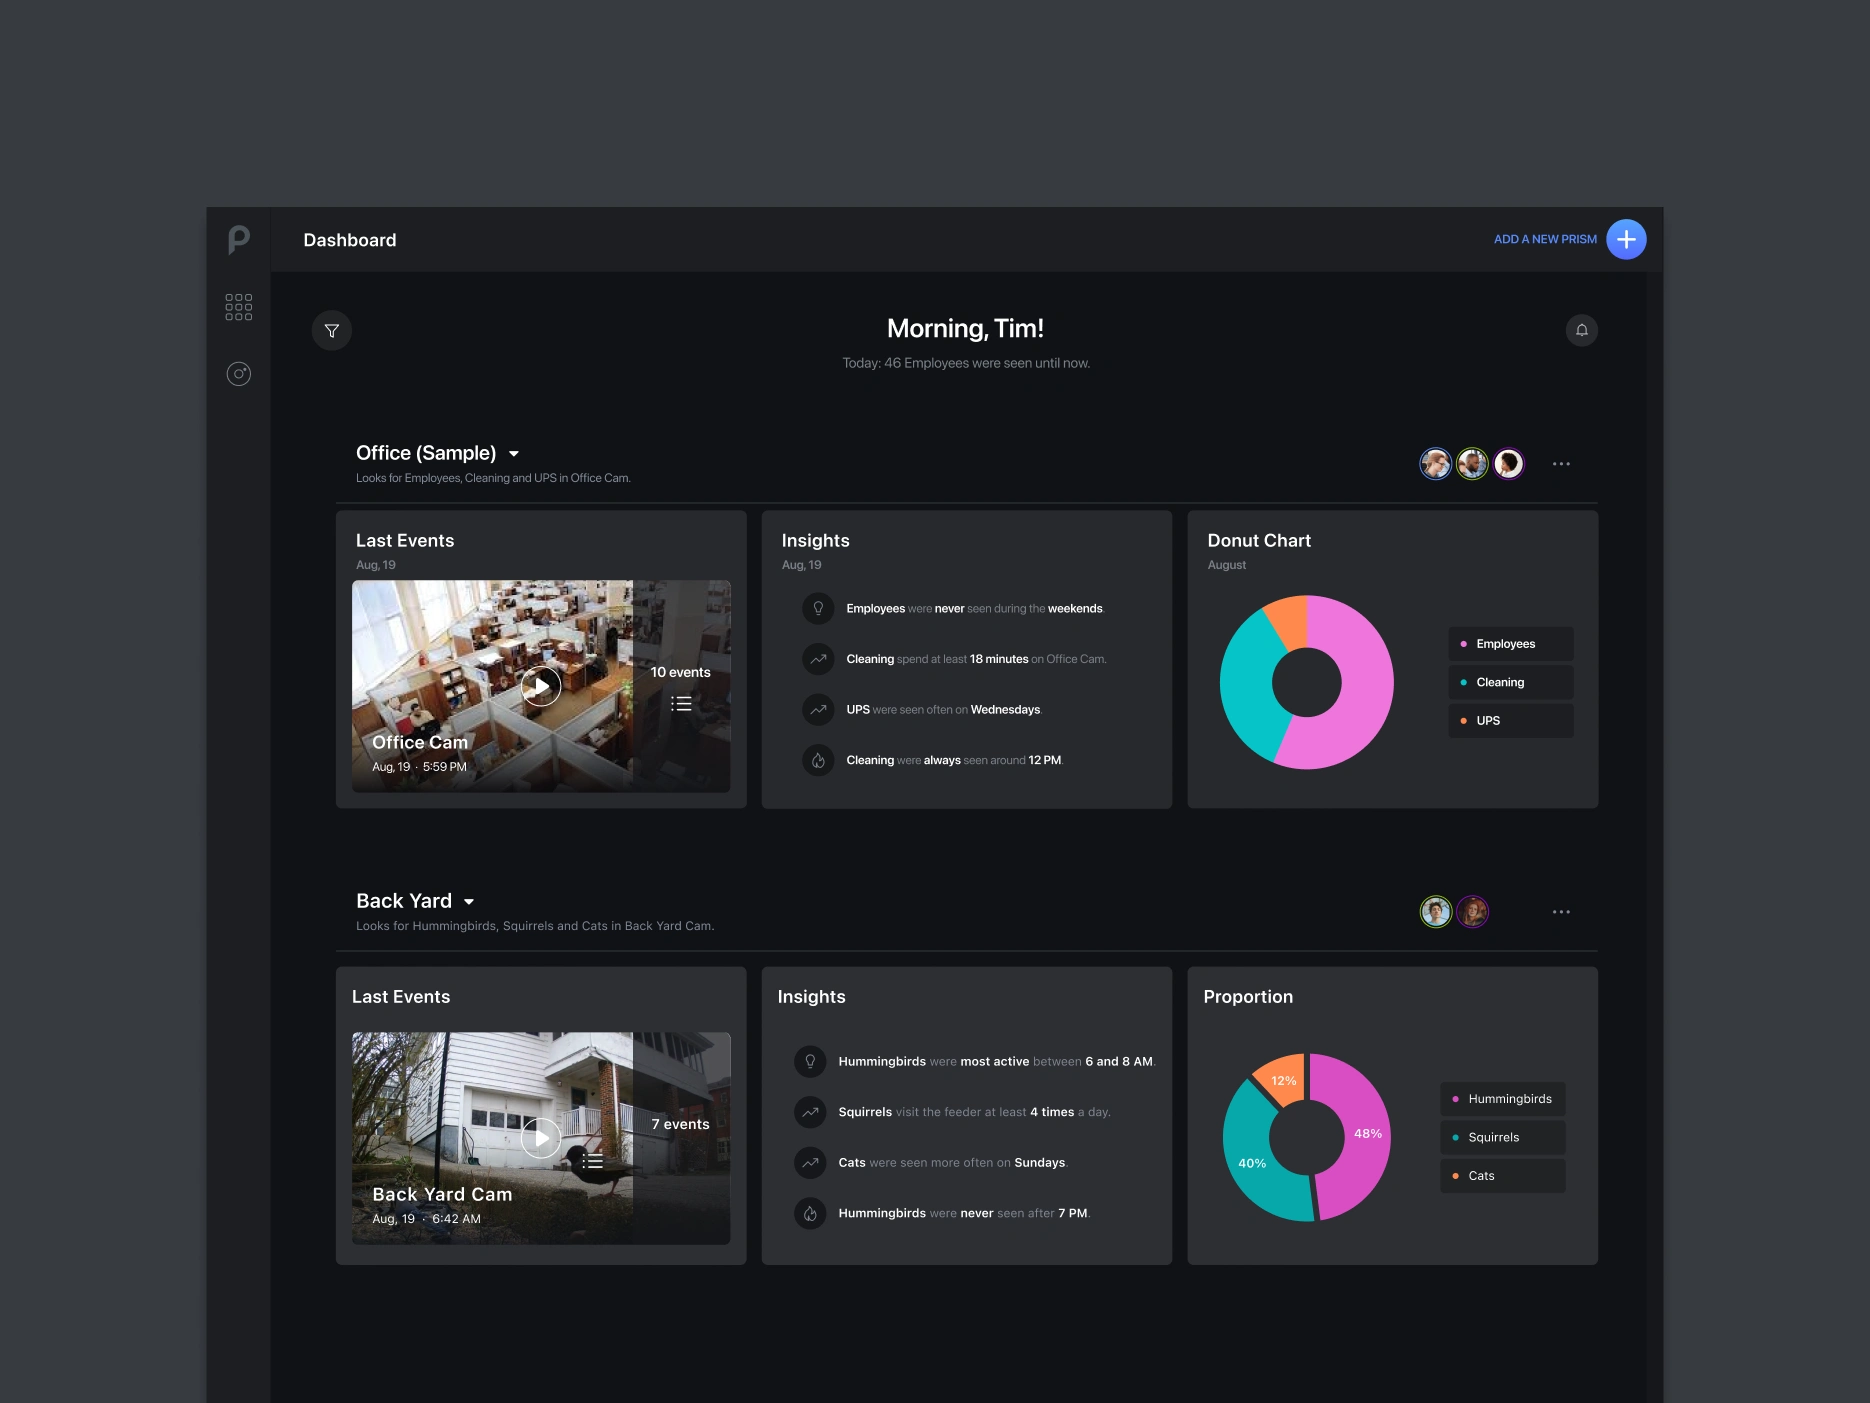
Prism builds smart cameras that recognize people, objects and animals, and turn what they see into data. The idea is simple, but the analysis behind it isn't: machine-learning models identify and categorize elements in every frame. My job was to turn that stream of detections into answers a non-technical user could read and act on.
Role: Lead Product Designer (UX, UI and product)
Company: Prism.ai, 2018 to 2020
Team: remote design and front-end teams, working side by side with the client
Delivered: dashboard, data visualization widgets, user flows and a design system
The challenge
Raw computer-vision output is noisy: thousands of detections, timestamps and video clips. Users didn't want data. They wanted answers to simple questions:
When are the hummingbirds most active? Was the office empty on weekends?
The interface also had to make setting up the AI simple: choosing cameras and defining what each one should look for.
What I designed
Prisms: a dashboard that talks in plain language
Each "Prism" is a set of cameras with its own searches, for example Back Yard: hummingbirds, squirrels and cats. Every Prism gets a row of widgets with the latest events, proportion charts and insights. Instead of showing charts only, the system writes the patterns it finds as sentences: "Hummingbirds were most active between 6 and 8 AM", "Squirrels visit the feeder at least 4 times a day".
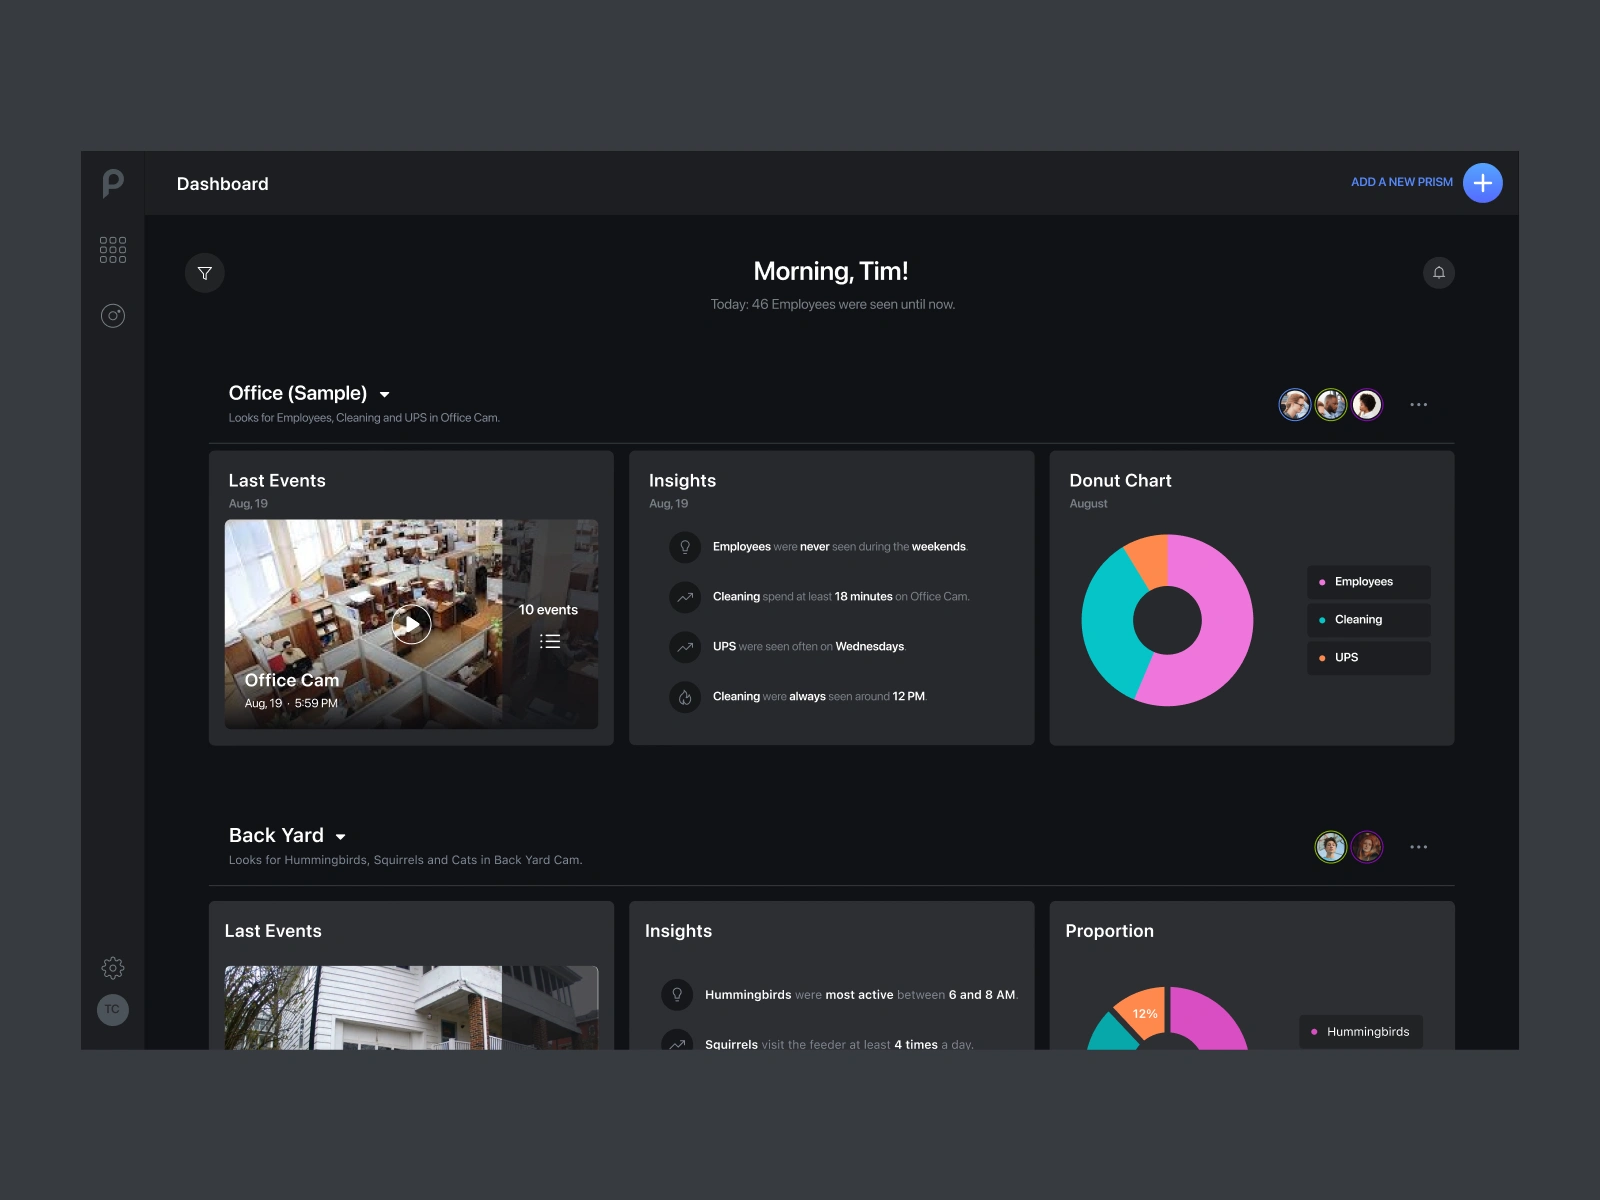
Each Prism groups a set of cameras, with widgets that surface the patterns found in the footage.
Smart widgets
I designed a library of widgets for showing AI-generated data from images: event galleries, tapestry and tile views, counting, highlights, event listings, a journal, and week, month and heatmap calendars. Each Prism can be set up around what matters to that user.
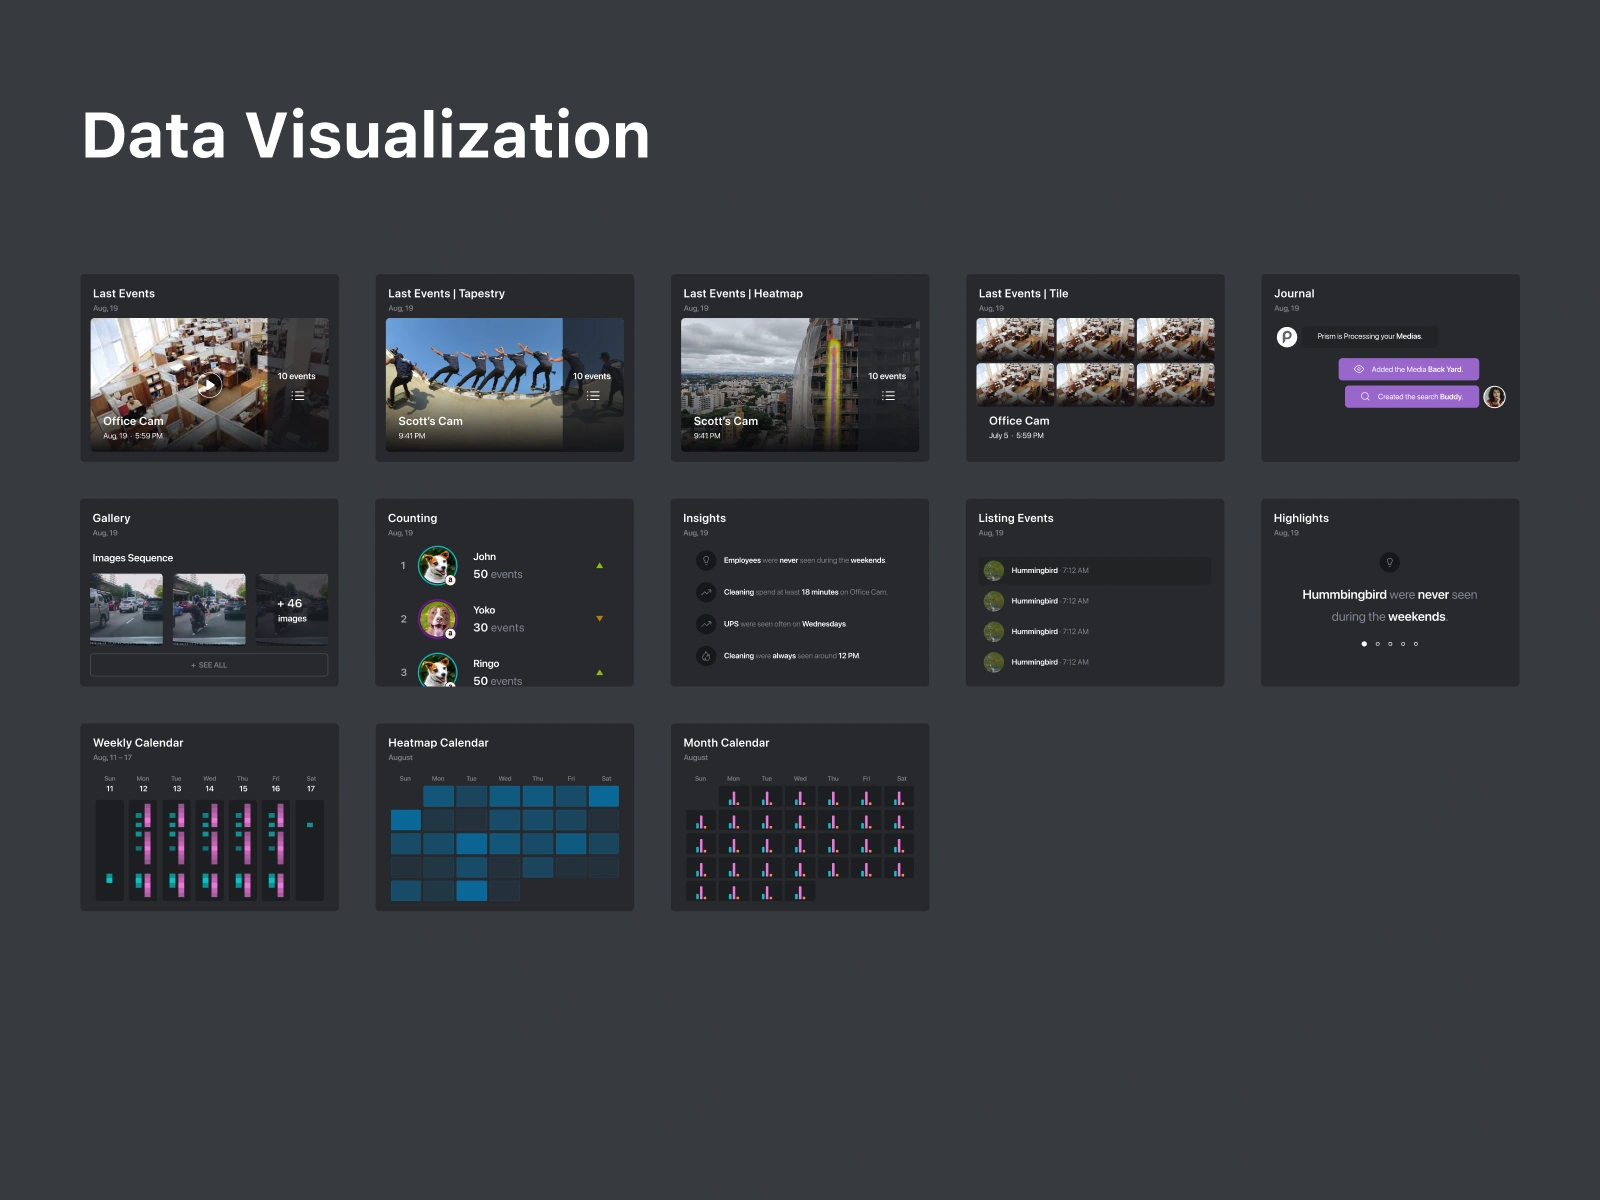
A widget library for showing AI-generated data from images.
Comparing elements over time
A week view compares how long each element stayed in view, such as cars, bicycles and pedestrians on a road camera. Picking a day opens its video clips on the side, so users can check what the AI actually saw.
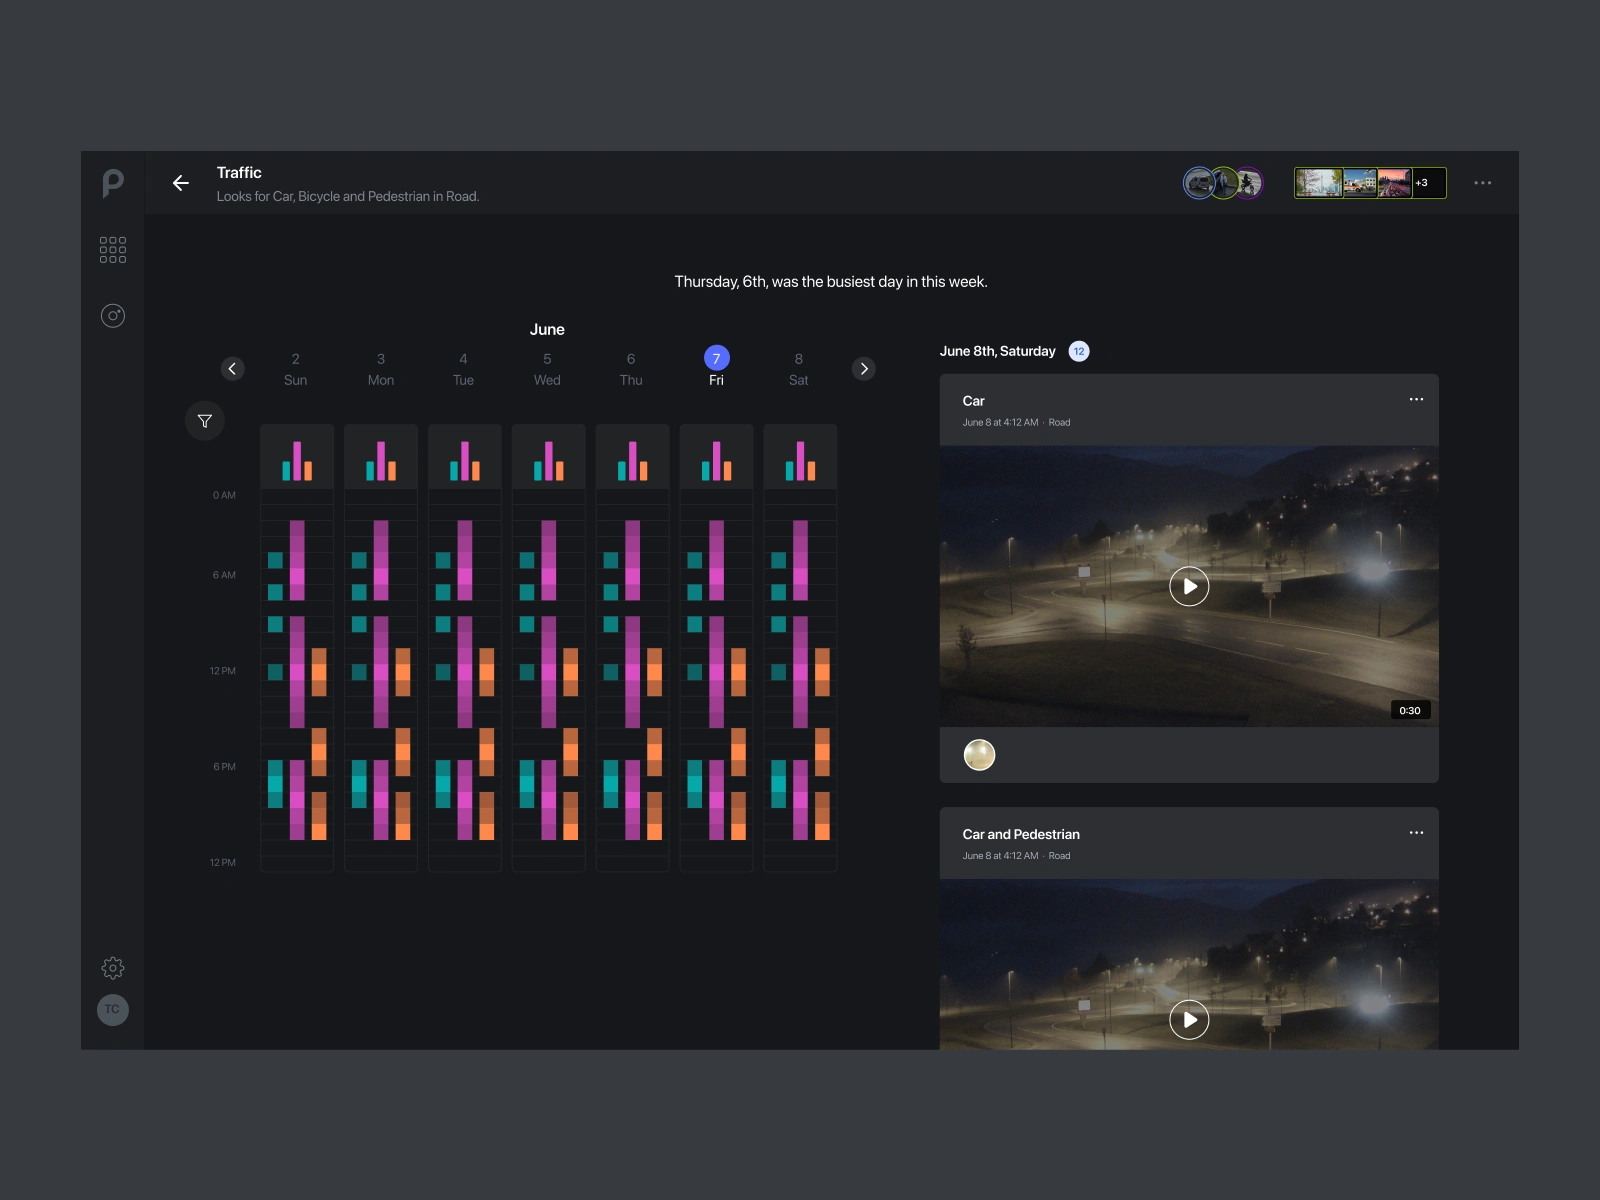
Week view comparing how long cars, bicycles and pedestrians stayed in view.
Presence heatmap
A month calendar shows the presence of a specific element across several days, so busy and quiet periods stand out at a glance. The header sums it up in one line, like "Thursday, 6th, was the most crowded day this month".
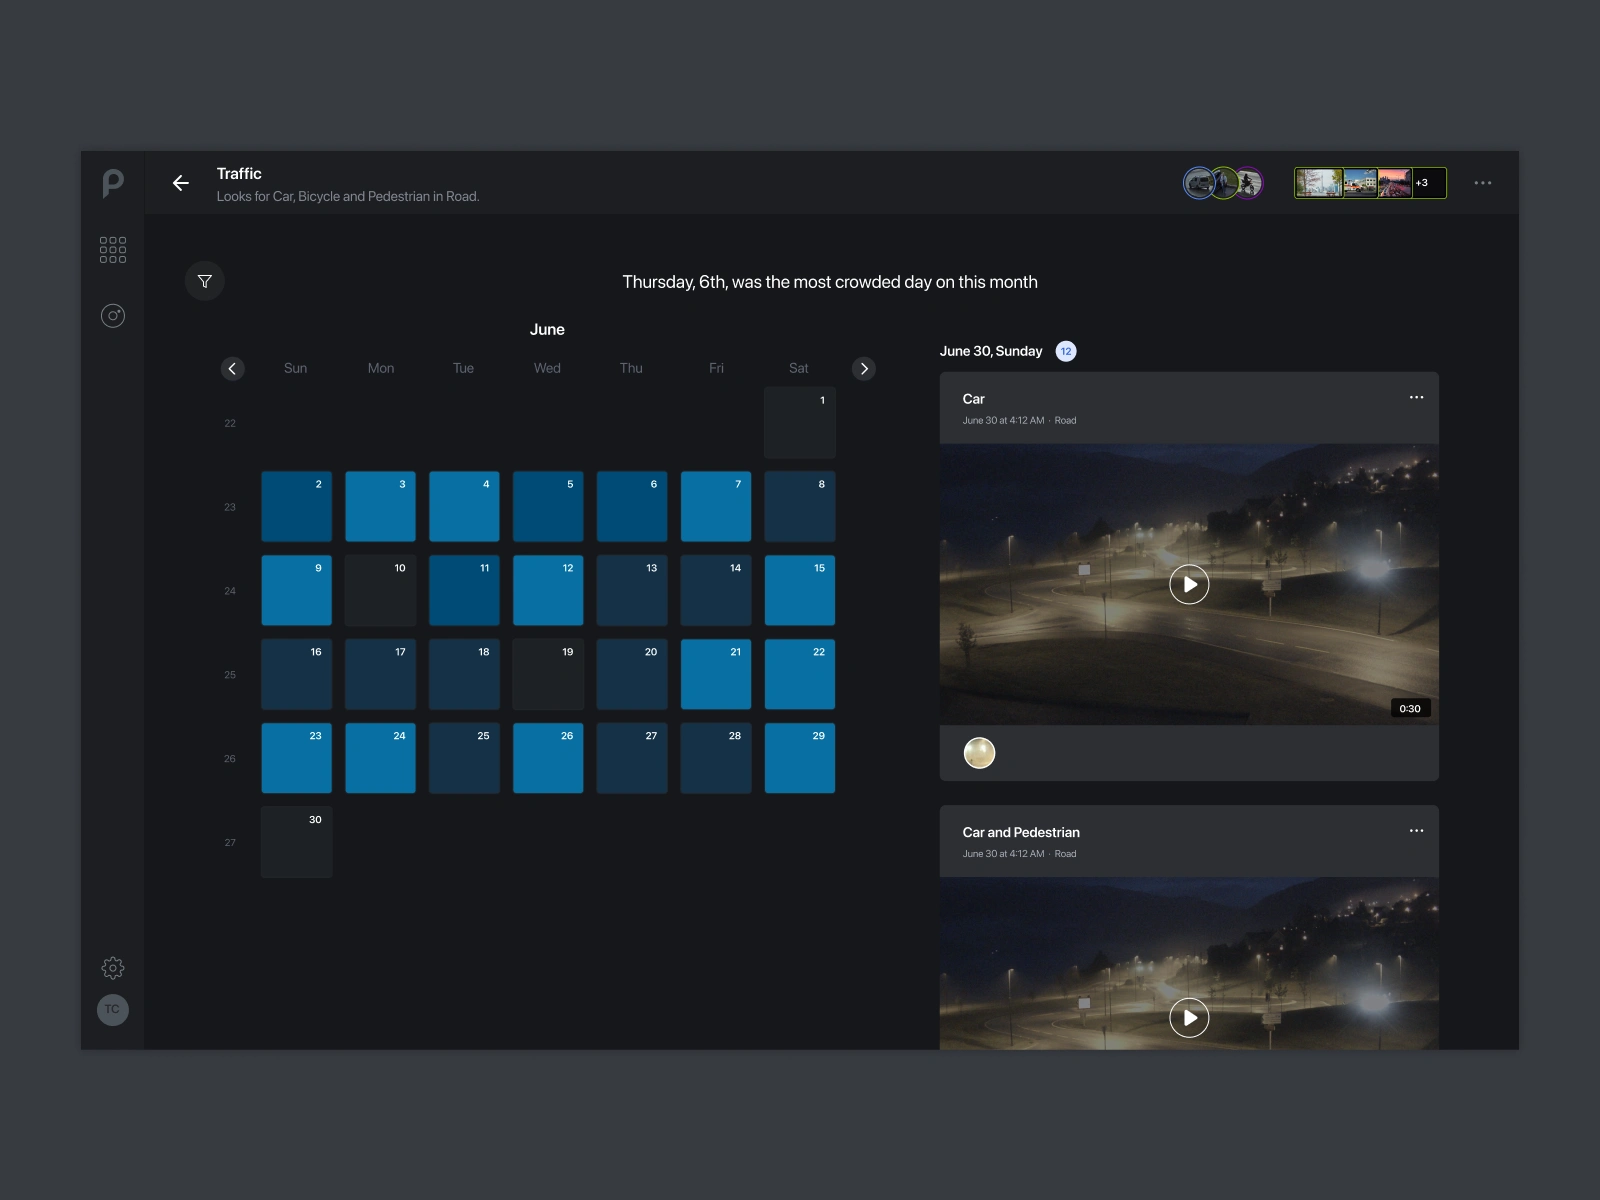
Heatmap of a specific element across the month.
AI timeline
We also explored an auto-generated feed where important events are reported as they happen. The Prism Assistant joins the feed too: when it spots a new pattern in the footage, it suggests adding it to the user's searches.
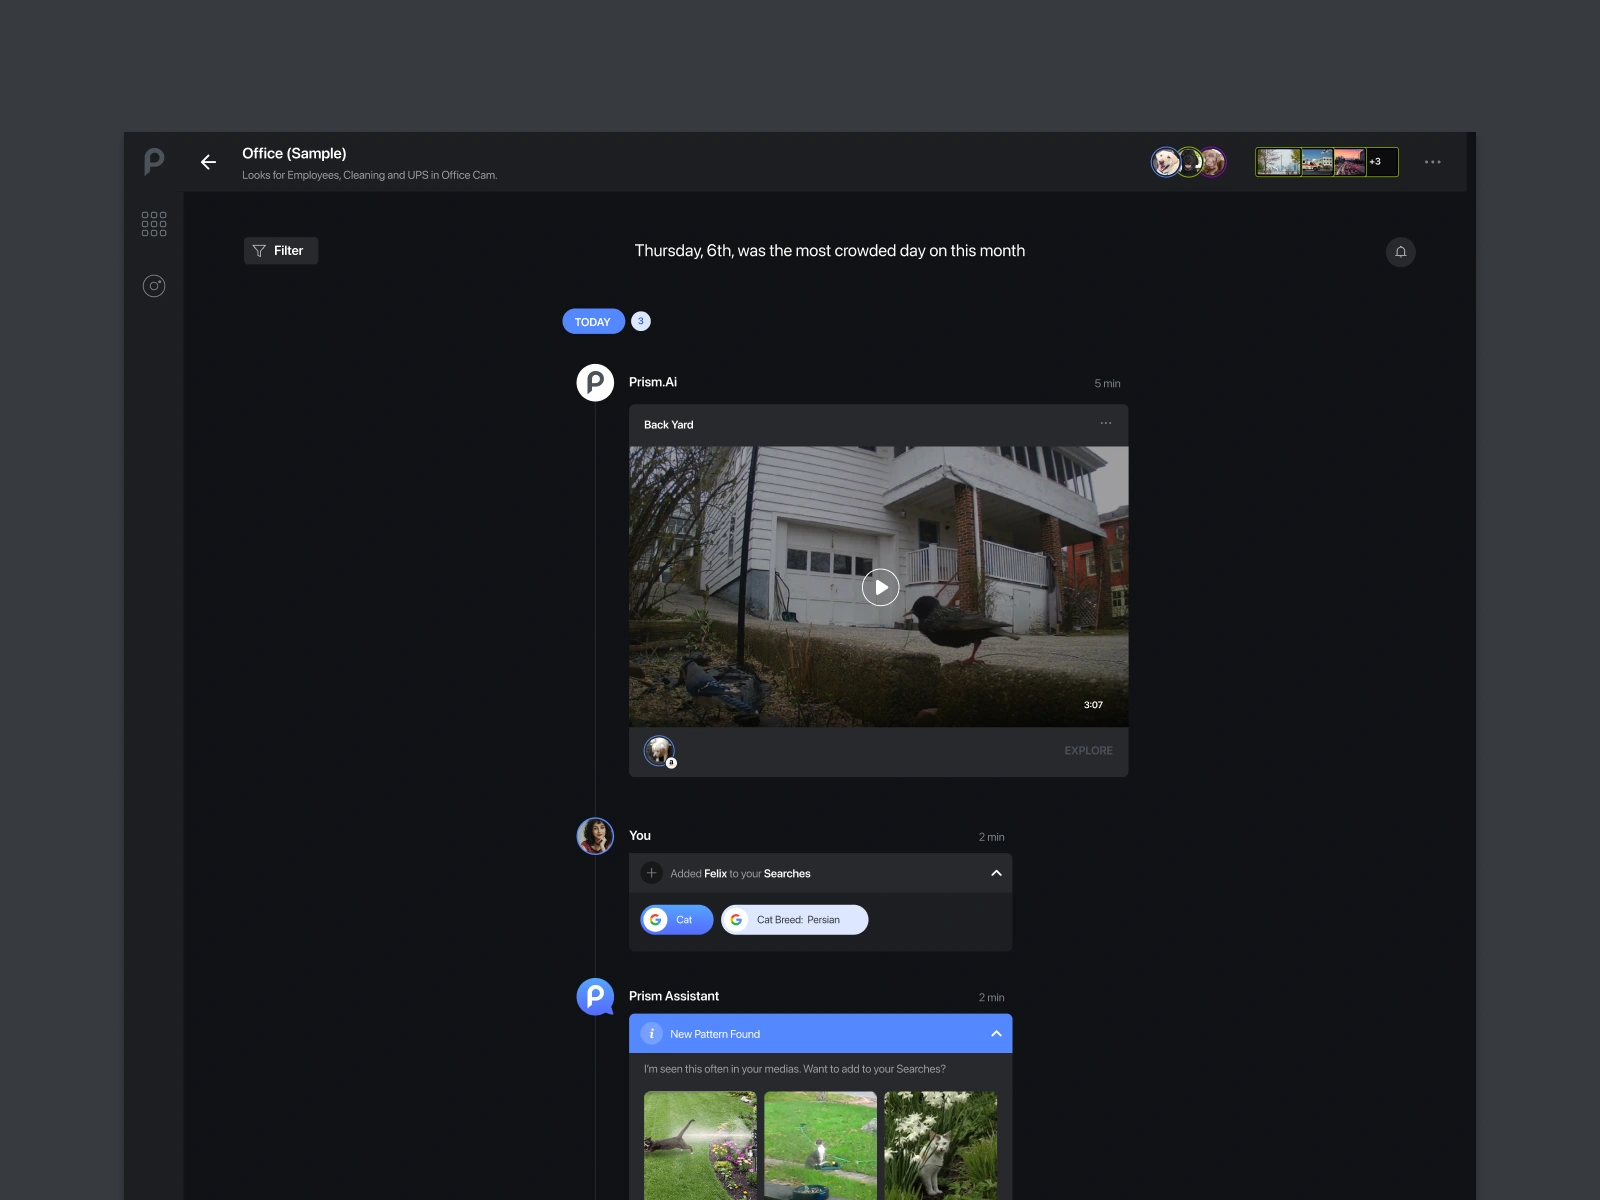
Auto-generated feed, with the Prism Assistant suggesting new searches.
How we worked
I led the design across UX, UI and product, and coordinated remote design and front-end teams. A detailed design system documented every component and state for developers. The process was participatory: the client, designers and developers shaped the product together through remote design sprints, client interviews and user testing. This co-creation method is the one I later described in my book COUX, and it's why the interfaces were both easy to use and realistic to build.
Like this project
Posted Oct 11, 2026
Lead designer for an AI camera platform: widget dashboard, data viz, presence heatmaps and a design system for developers. Remote design sprints.
Likes
0
Views
5