GPU Power Control UX/UI Design Study

Project body
An interface that won't let you apply an unsafe plan
A GPU cluster will exceed its power cap in 43 minutes. The engineer has to cut the load fast without stopping a model training run or slowing the service for customers. This is a concept project with fictional data.
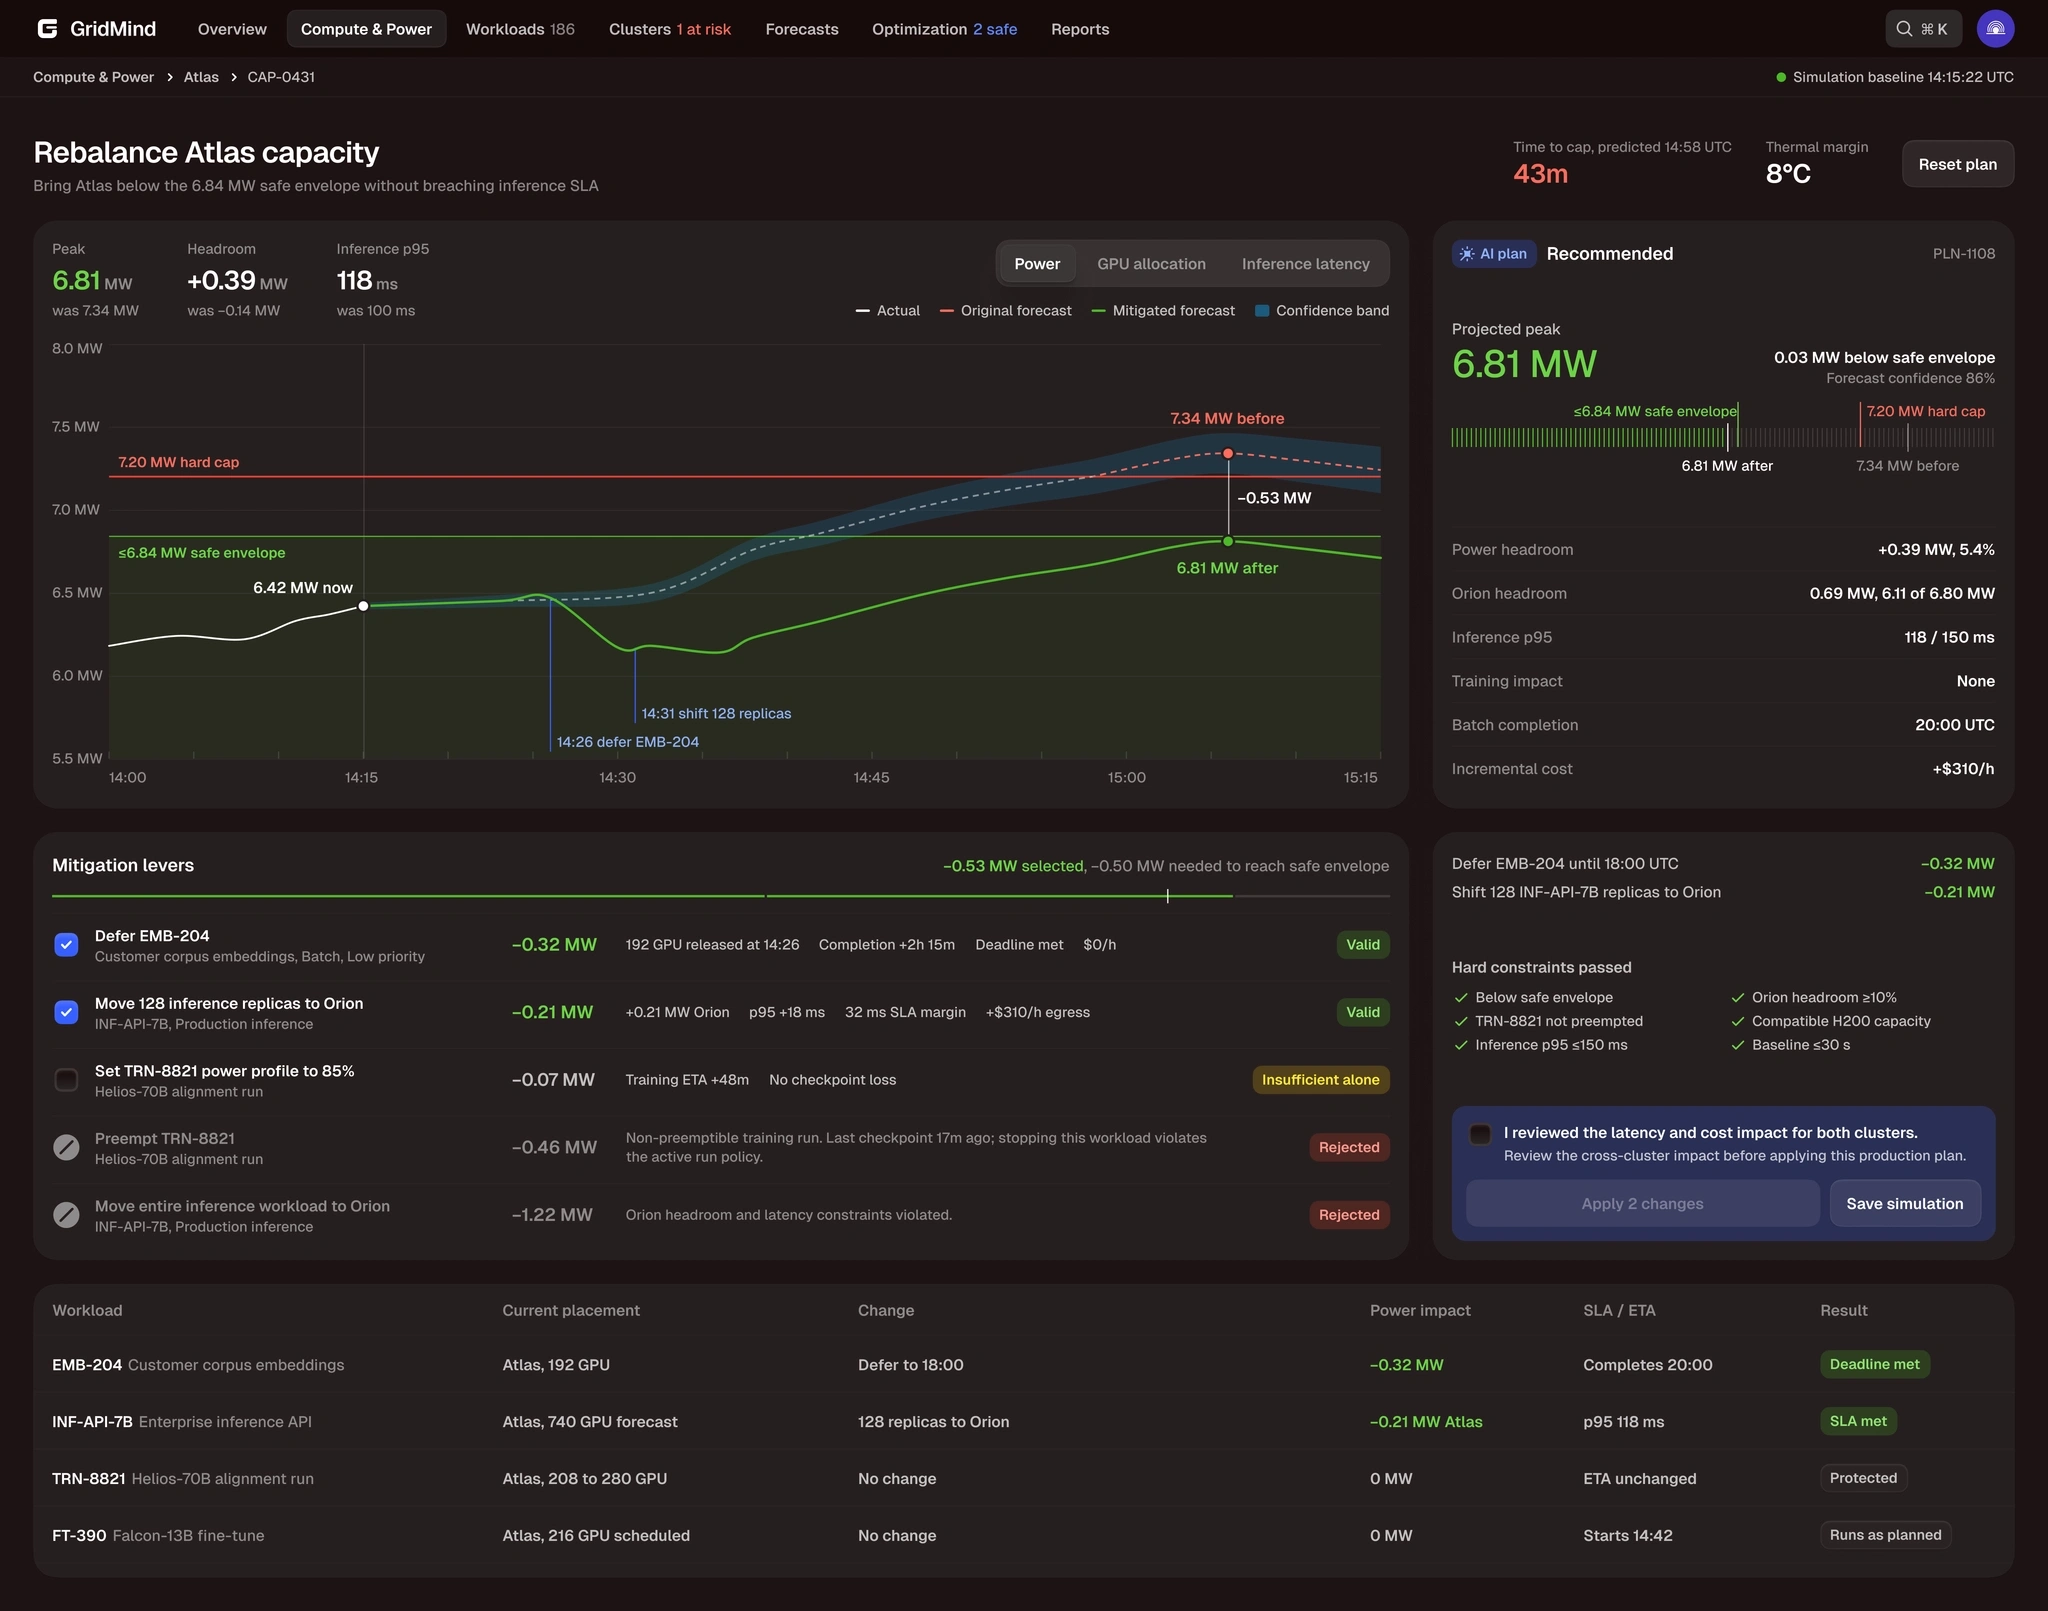
The Apply button is still disabled: the engineer hasn't confirmed reviewing the impact.
The problem
The Atlas cluster draws 6.42 MW against a 7.20 MW cap, and the forecast crosses the cap at 14:58 UTC. There are enough free GPUs, so a standard utilization dashboard won't show the risk.
The engineer has to decide quickly, and mistakes are easy to make: losing training progress, breaking the latency SLA, or applying a plan based on stale data.

3,392 of 4,096 GPUs are allocated, but the forecast is already above the cap.
Overview: show the risk first
The main chart combines actual power, the forecast, and the cap. Next to it are the three workloads driving the increase and the path to the plan.
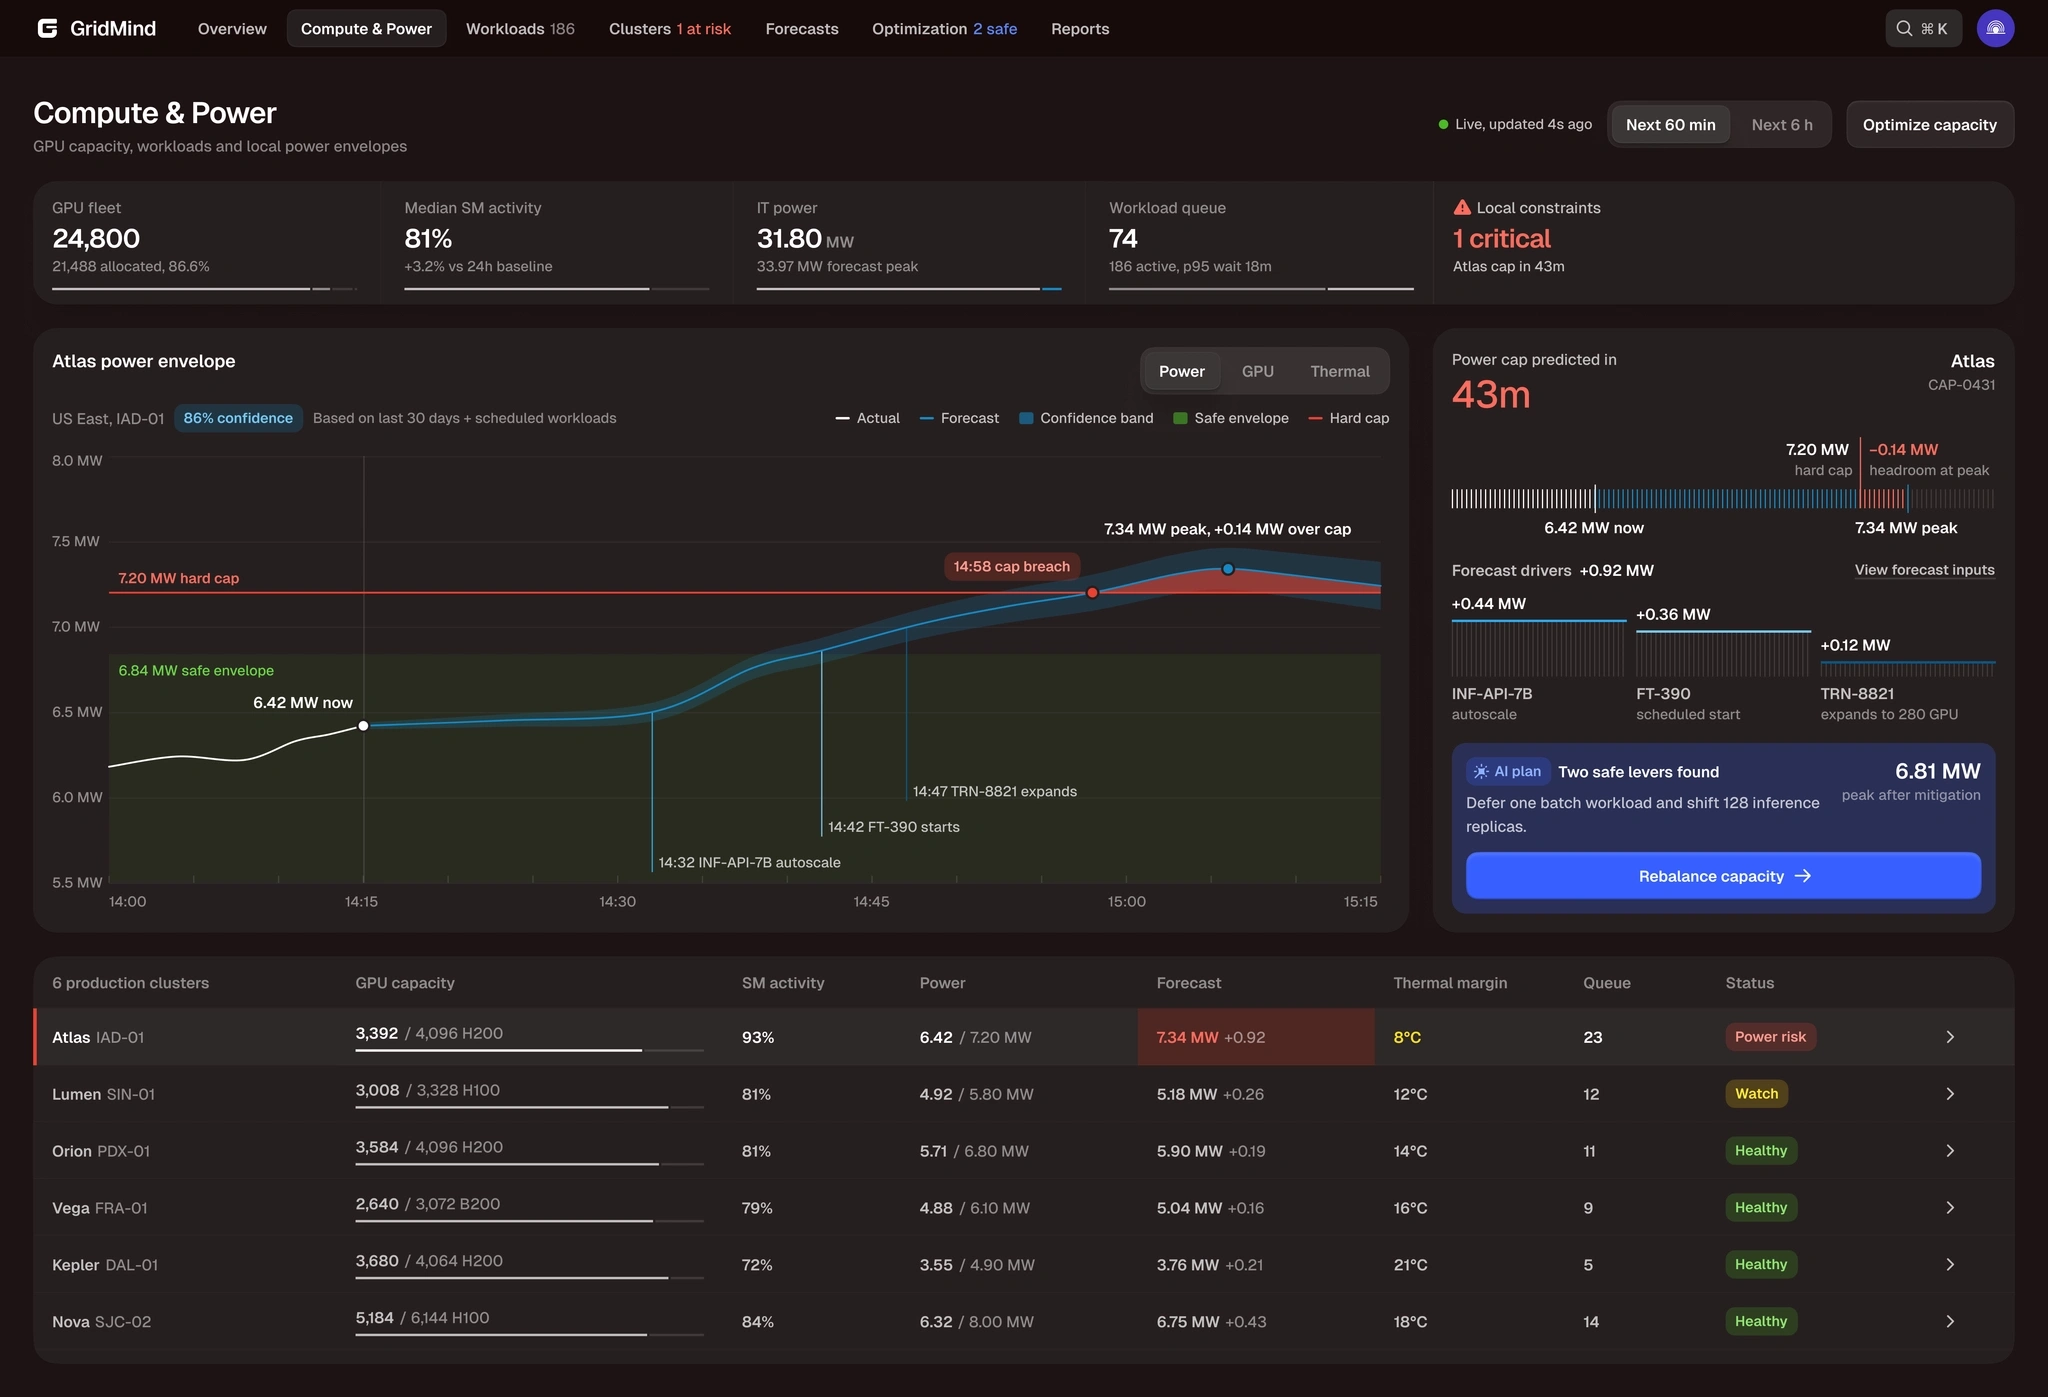
The engineer sees right away when the cluster will cross the cap and which workloads are driving it.
Plan: compare the options
The system suggests two actions. The engineer can change them and immediately see the new peak, latency, and cost. Blocked options stay in the list with a reason, because the engineer will consider them anyway.
I ruled out drag-and-drop for moving workloads because it makes an invalid plan too easy to build.
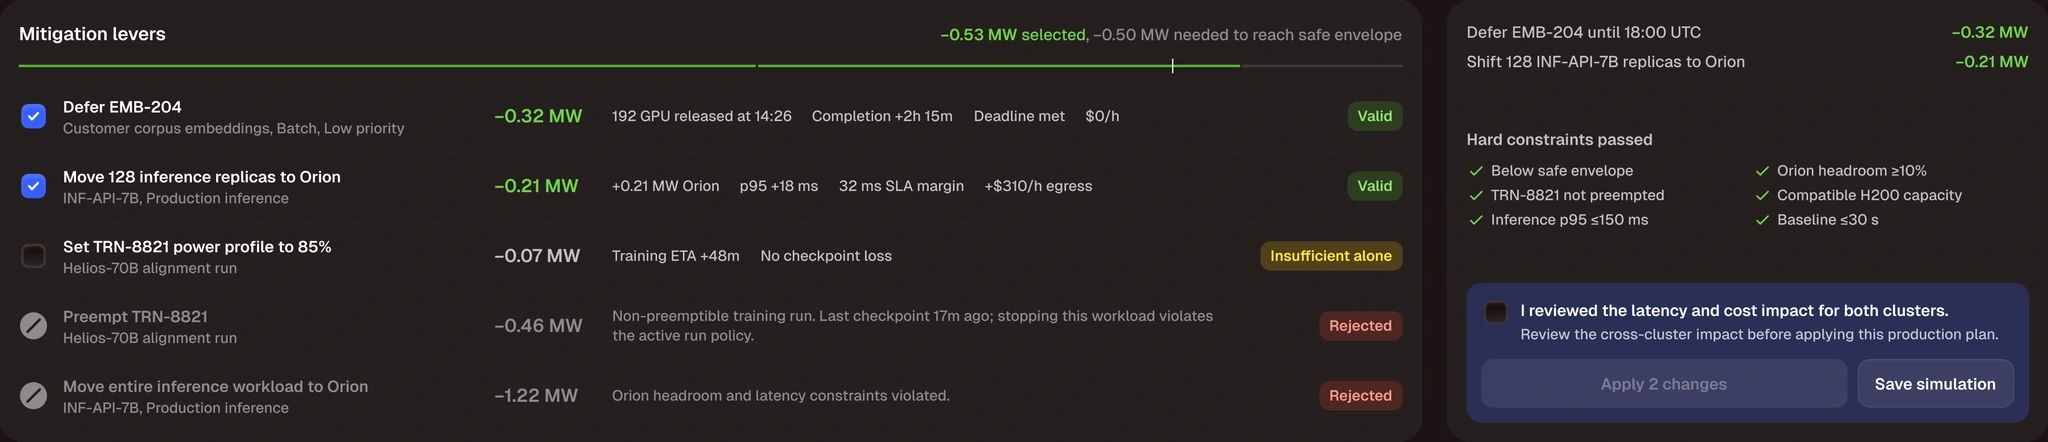
The selected actions cut the peak by 0.53 MW. The plan needs 0.50 MW.

The strongest option would remove 1.22 MW, but it's blocked, and the reason sits right next to it.
When a plan can't be applied
A plan can be applied only when three conditions are met: it brings the load within the safe envelope, the data is no more than 30 seconds old, and the engineer has confirmed the review. If a condition fails, the interface explains what's wrong and what to do next.
I skipped a separate confirmation dialog because the consequences are already right next to the button.
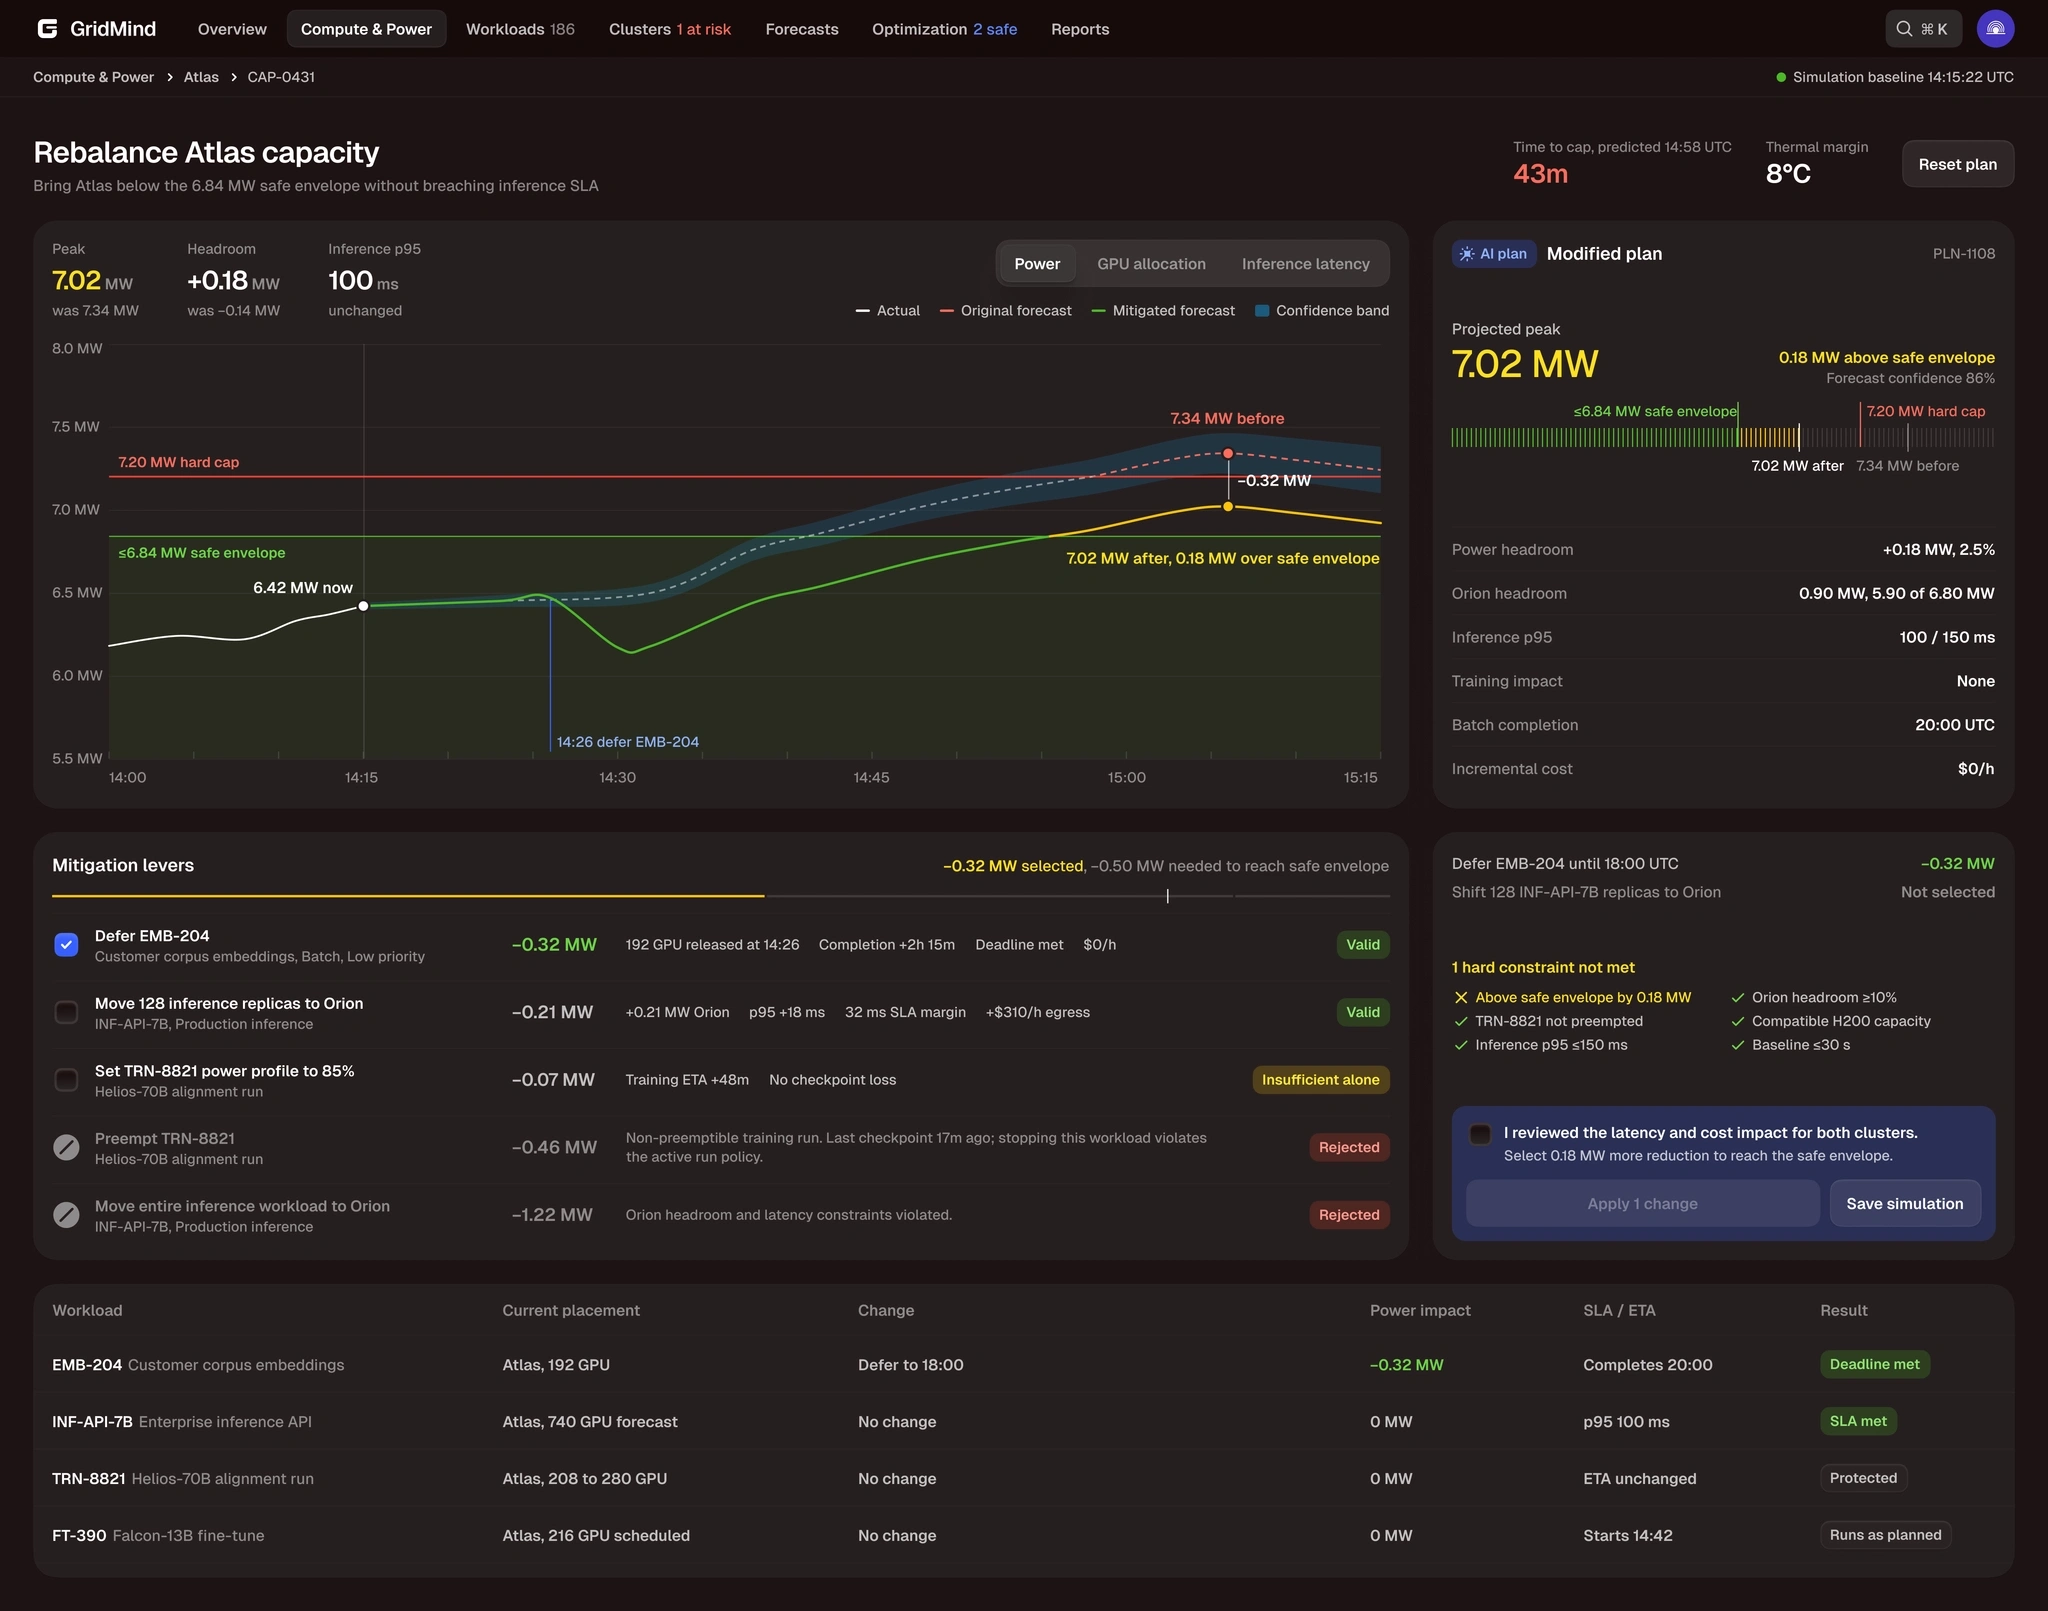
A 7.02 MW peak is below the cap but above the 6.84 MW safe envelope, so the plan can't be applied.
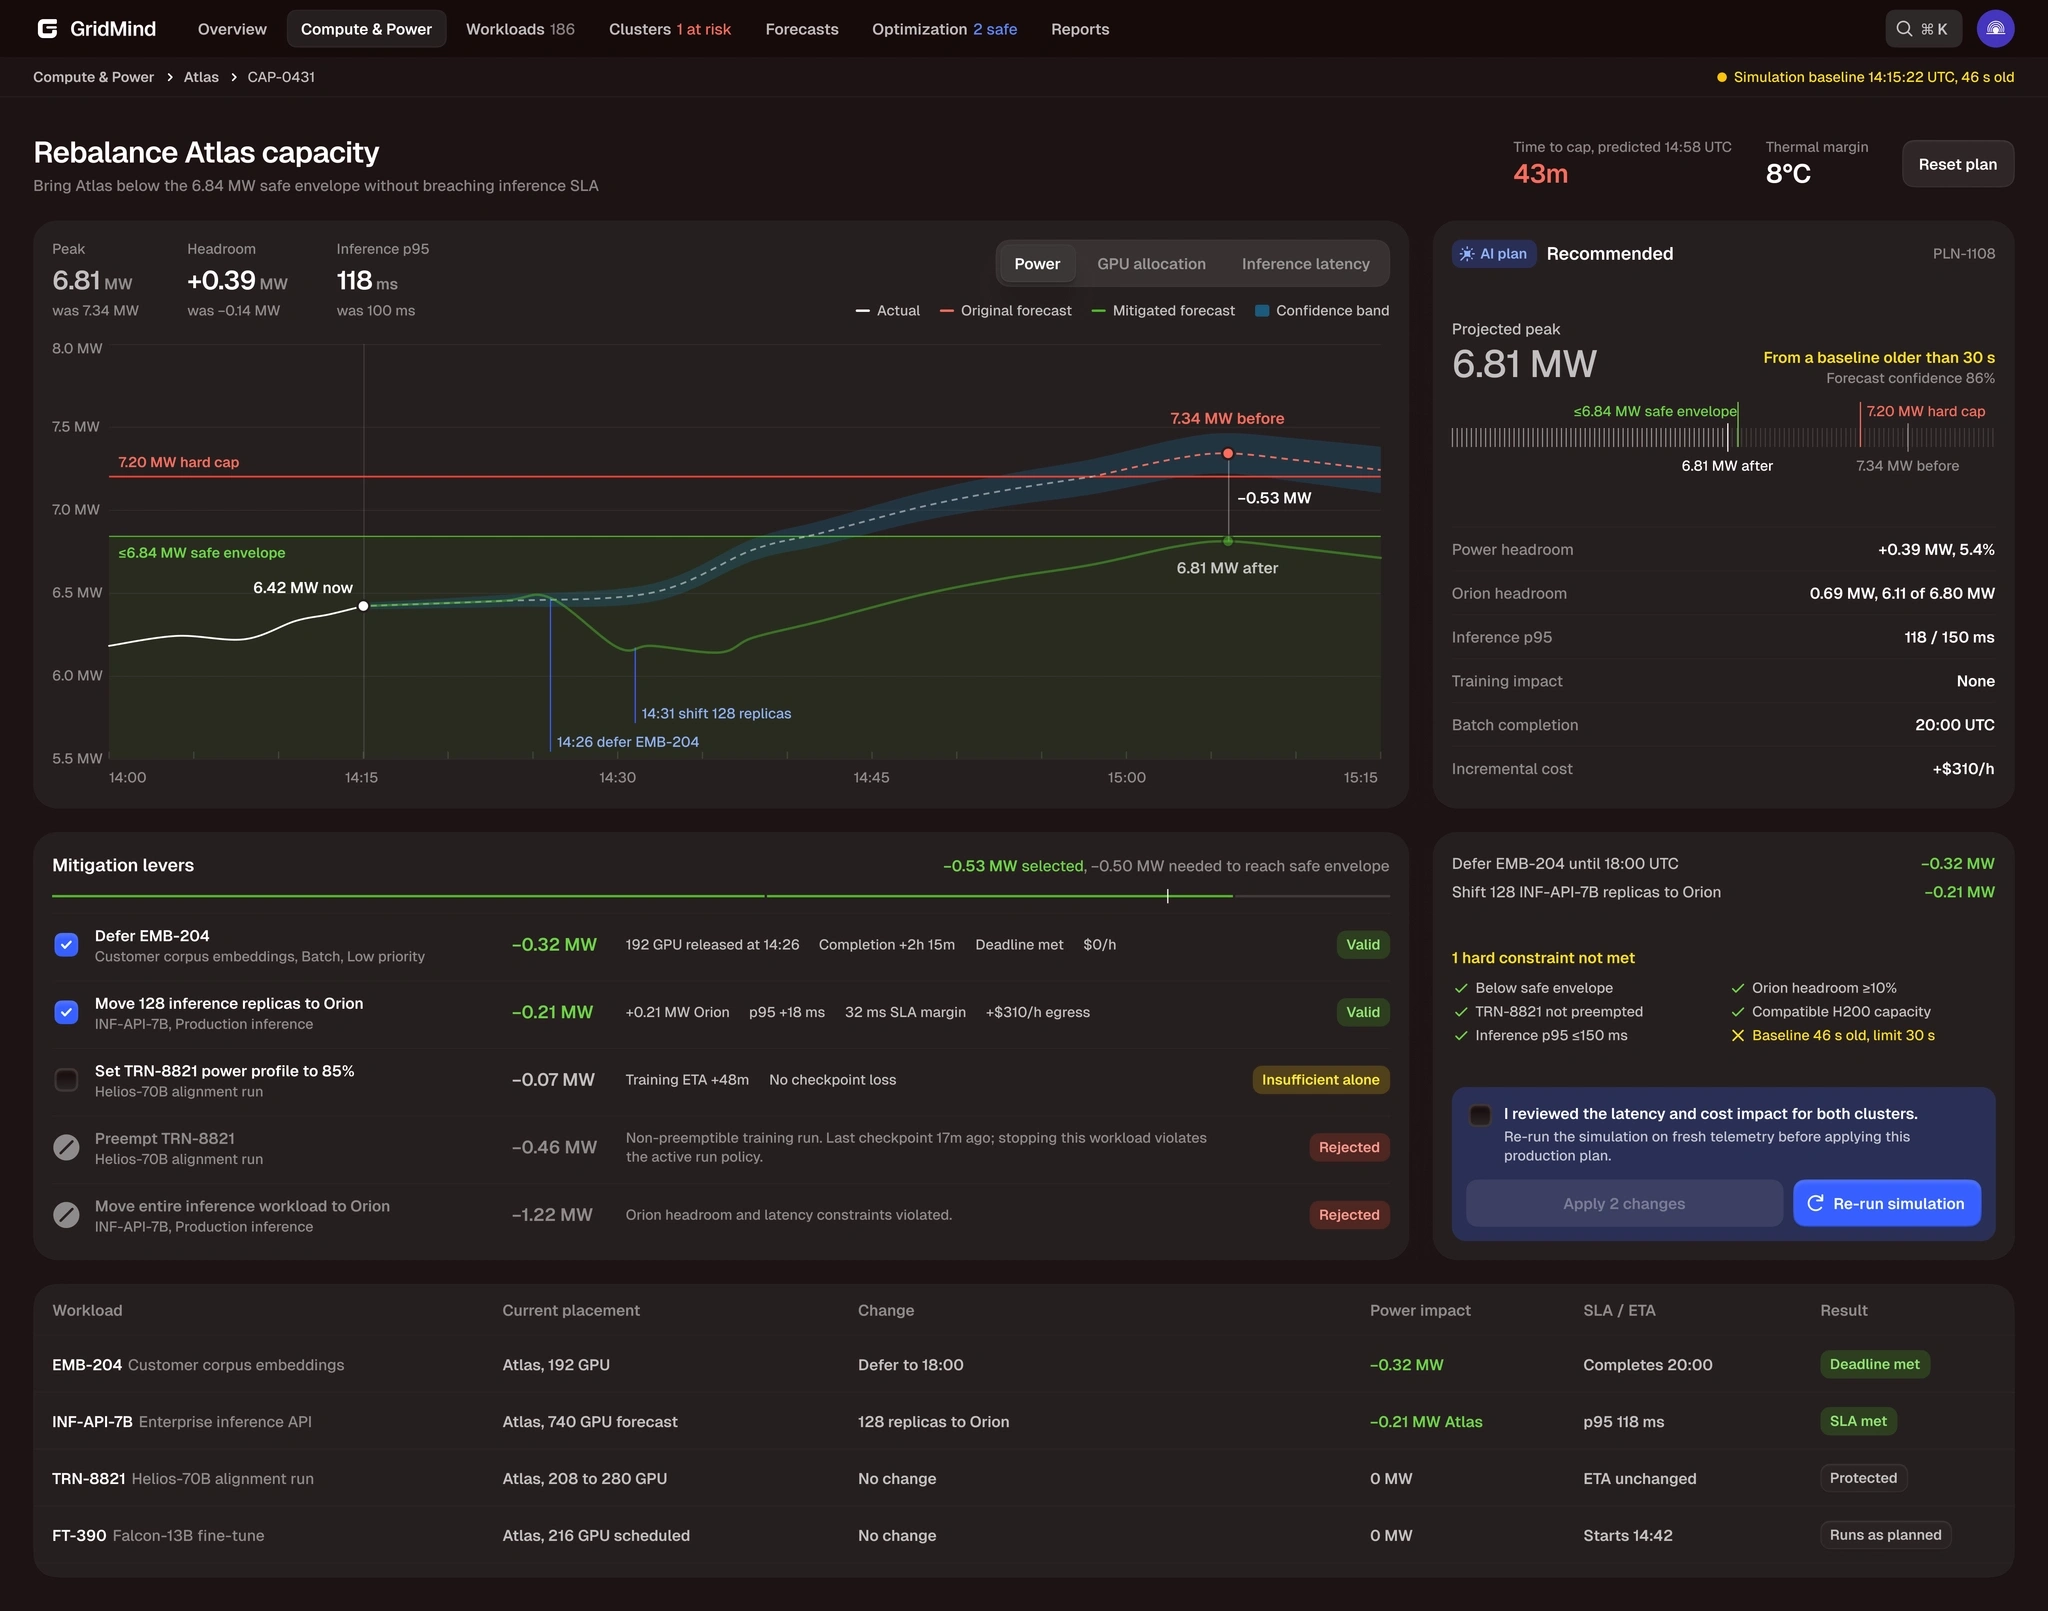
The simulation is 46 seconds old and the limit is 30, so the interface prompts a re-run.
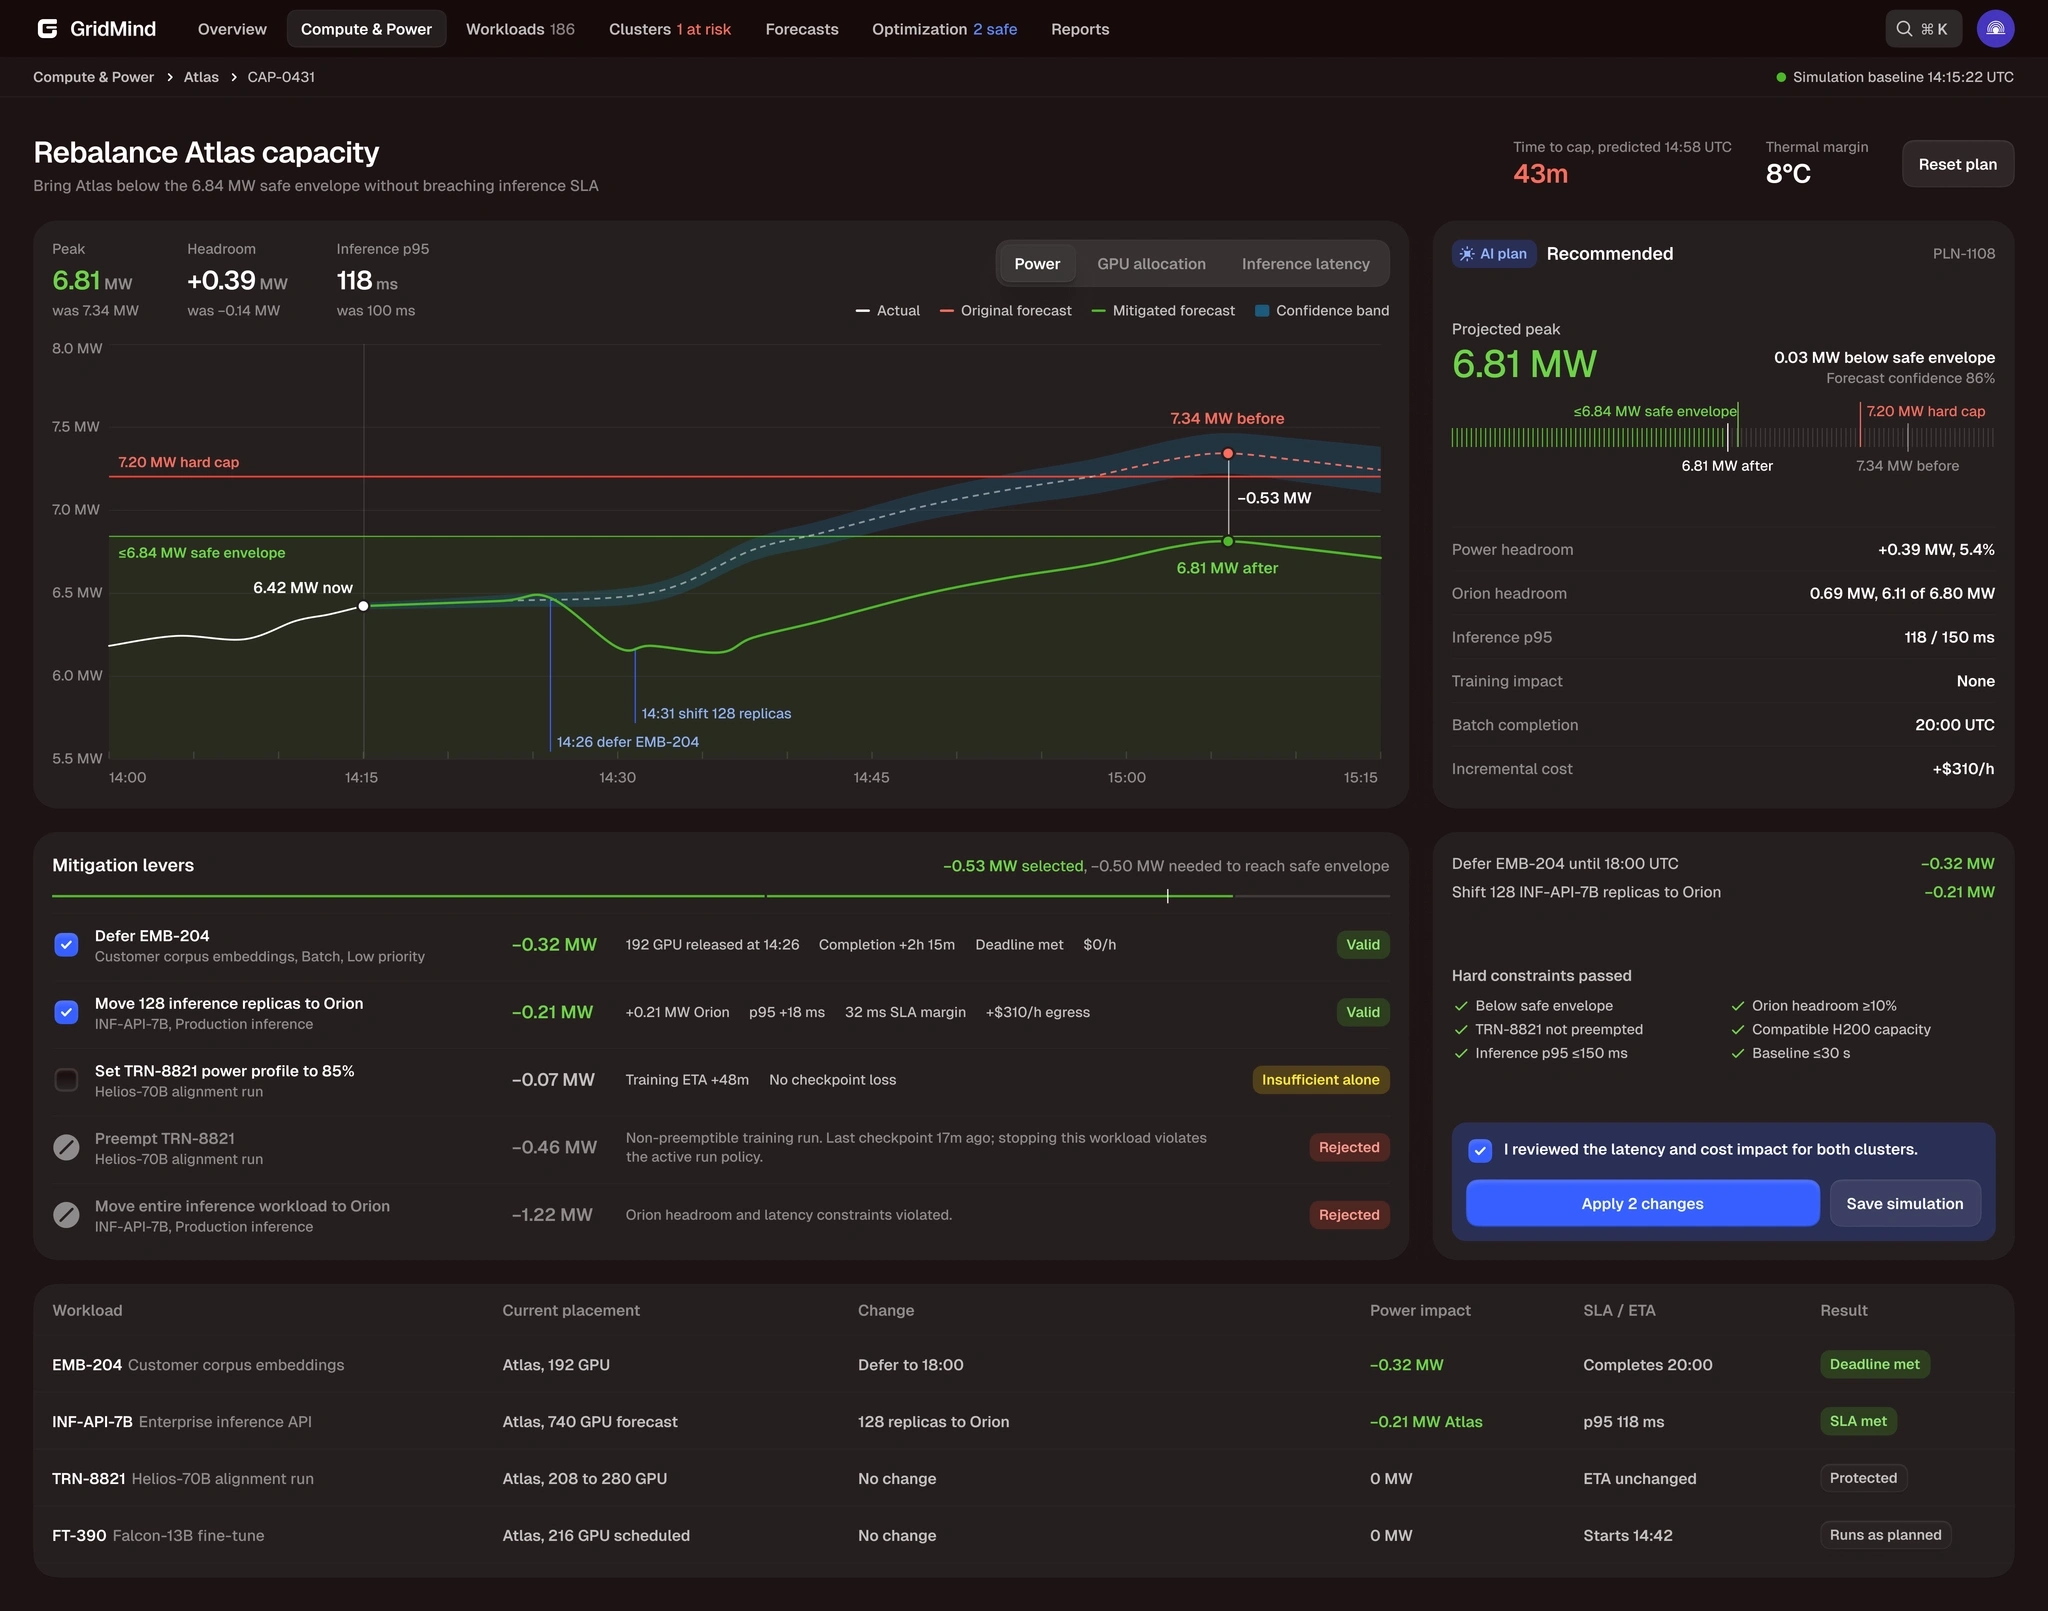
All conditions are met and the engineer has confirmed the review, so the button is active.
After the plan is applied
The result appears on the overview where the proposed plan used to be, so there's no need to look for it. The cluster moves to Watch: the cap is no longer at risk, but headroom is small.
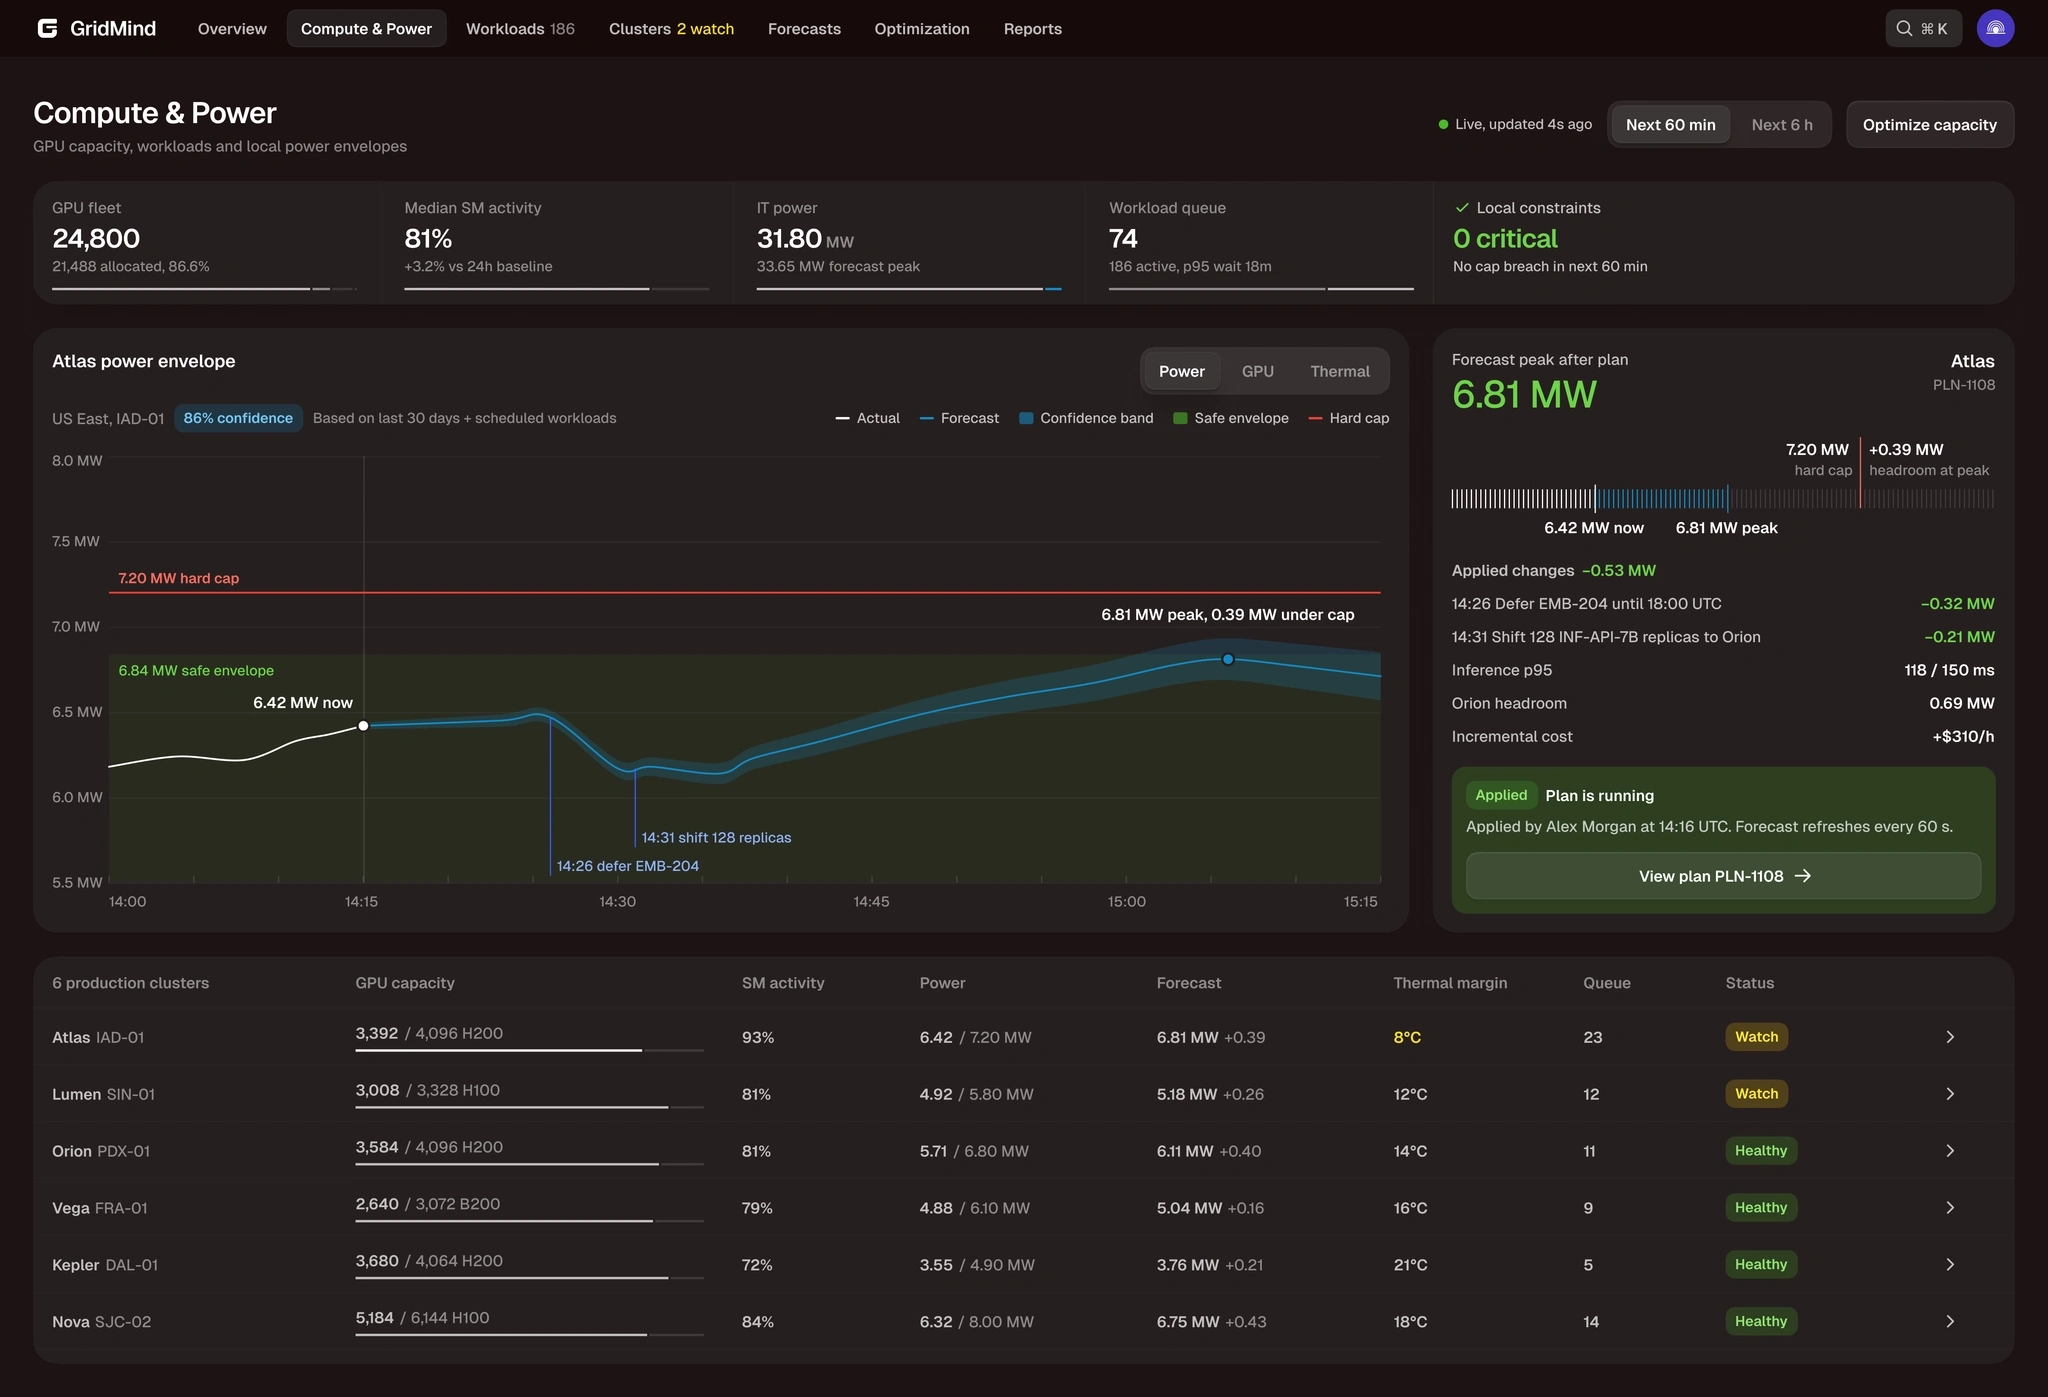
The screen shows who applied the plan, when, and what the forecast is now.
Scope and next steps
This is a portfolio concept, so there are no post-launch metrics. The company, clusters, and costs are fictional, and GridMind is a working name. Roles, approvals, loading and error states, and a mobile version are out of scope.
Next, I'd test the flow with engineers, design a way to roll back an applied plan, and decide whether it needs a second approval.
0 likes · 0 views · Oct 25, 2026
UX/UI study for GPU infrastructure: connect power risks to workloads and compare power, latency and cost before approving a mitigation plan.