Global Tourism Interactive Dashboard
Kris Bruurs
Global Tourism Dashboard
A portfolio project showcasing interactive data visualization and dashboard development skills using Streamlit and Plotly. This project demonstrates the ability to create dynamic, user-friendly dashboards with features like interactive world maps, dual-axis charts, and real-time filtering.
Project Overview
This interactive dashboard explores the relationship between global tourism revenue and GDP growth across different countries and years. While the focus is on demonstrating dashboard development capabilities rather than data perfection, the project showcases key skills in:
Interactive Visualizations: Choropleth maps with custom color scales and hover tooltips
User Interface Design: Multi-tab layouts, dropdowns, sliders, and responsive controls
Data Processing: ETL pipeline from raw data to dashboard-ready datasets
Multi-Chart Comparisons: Dual-axis line charts for country-specific trend analysis
Features
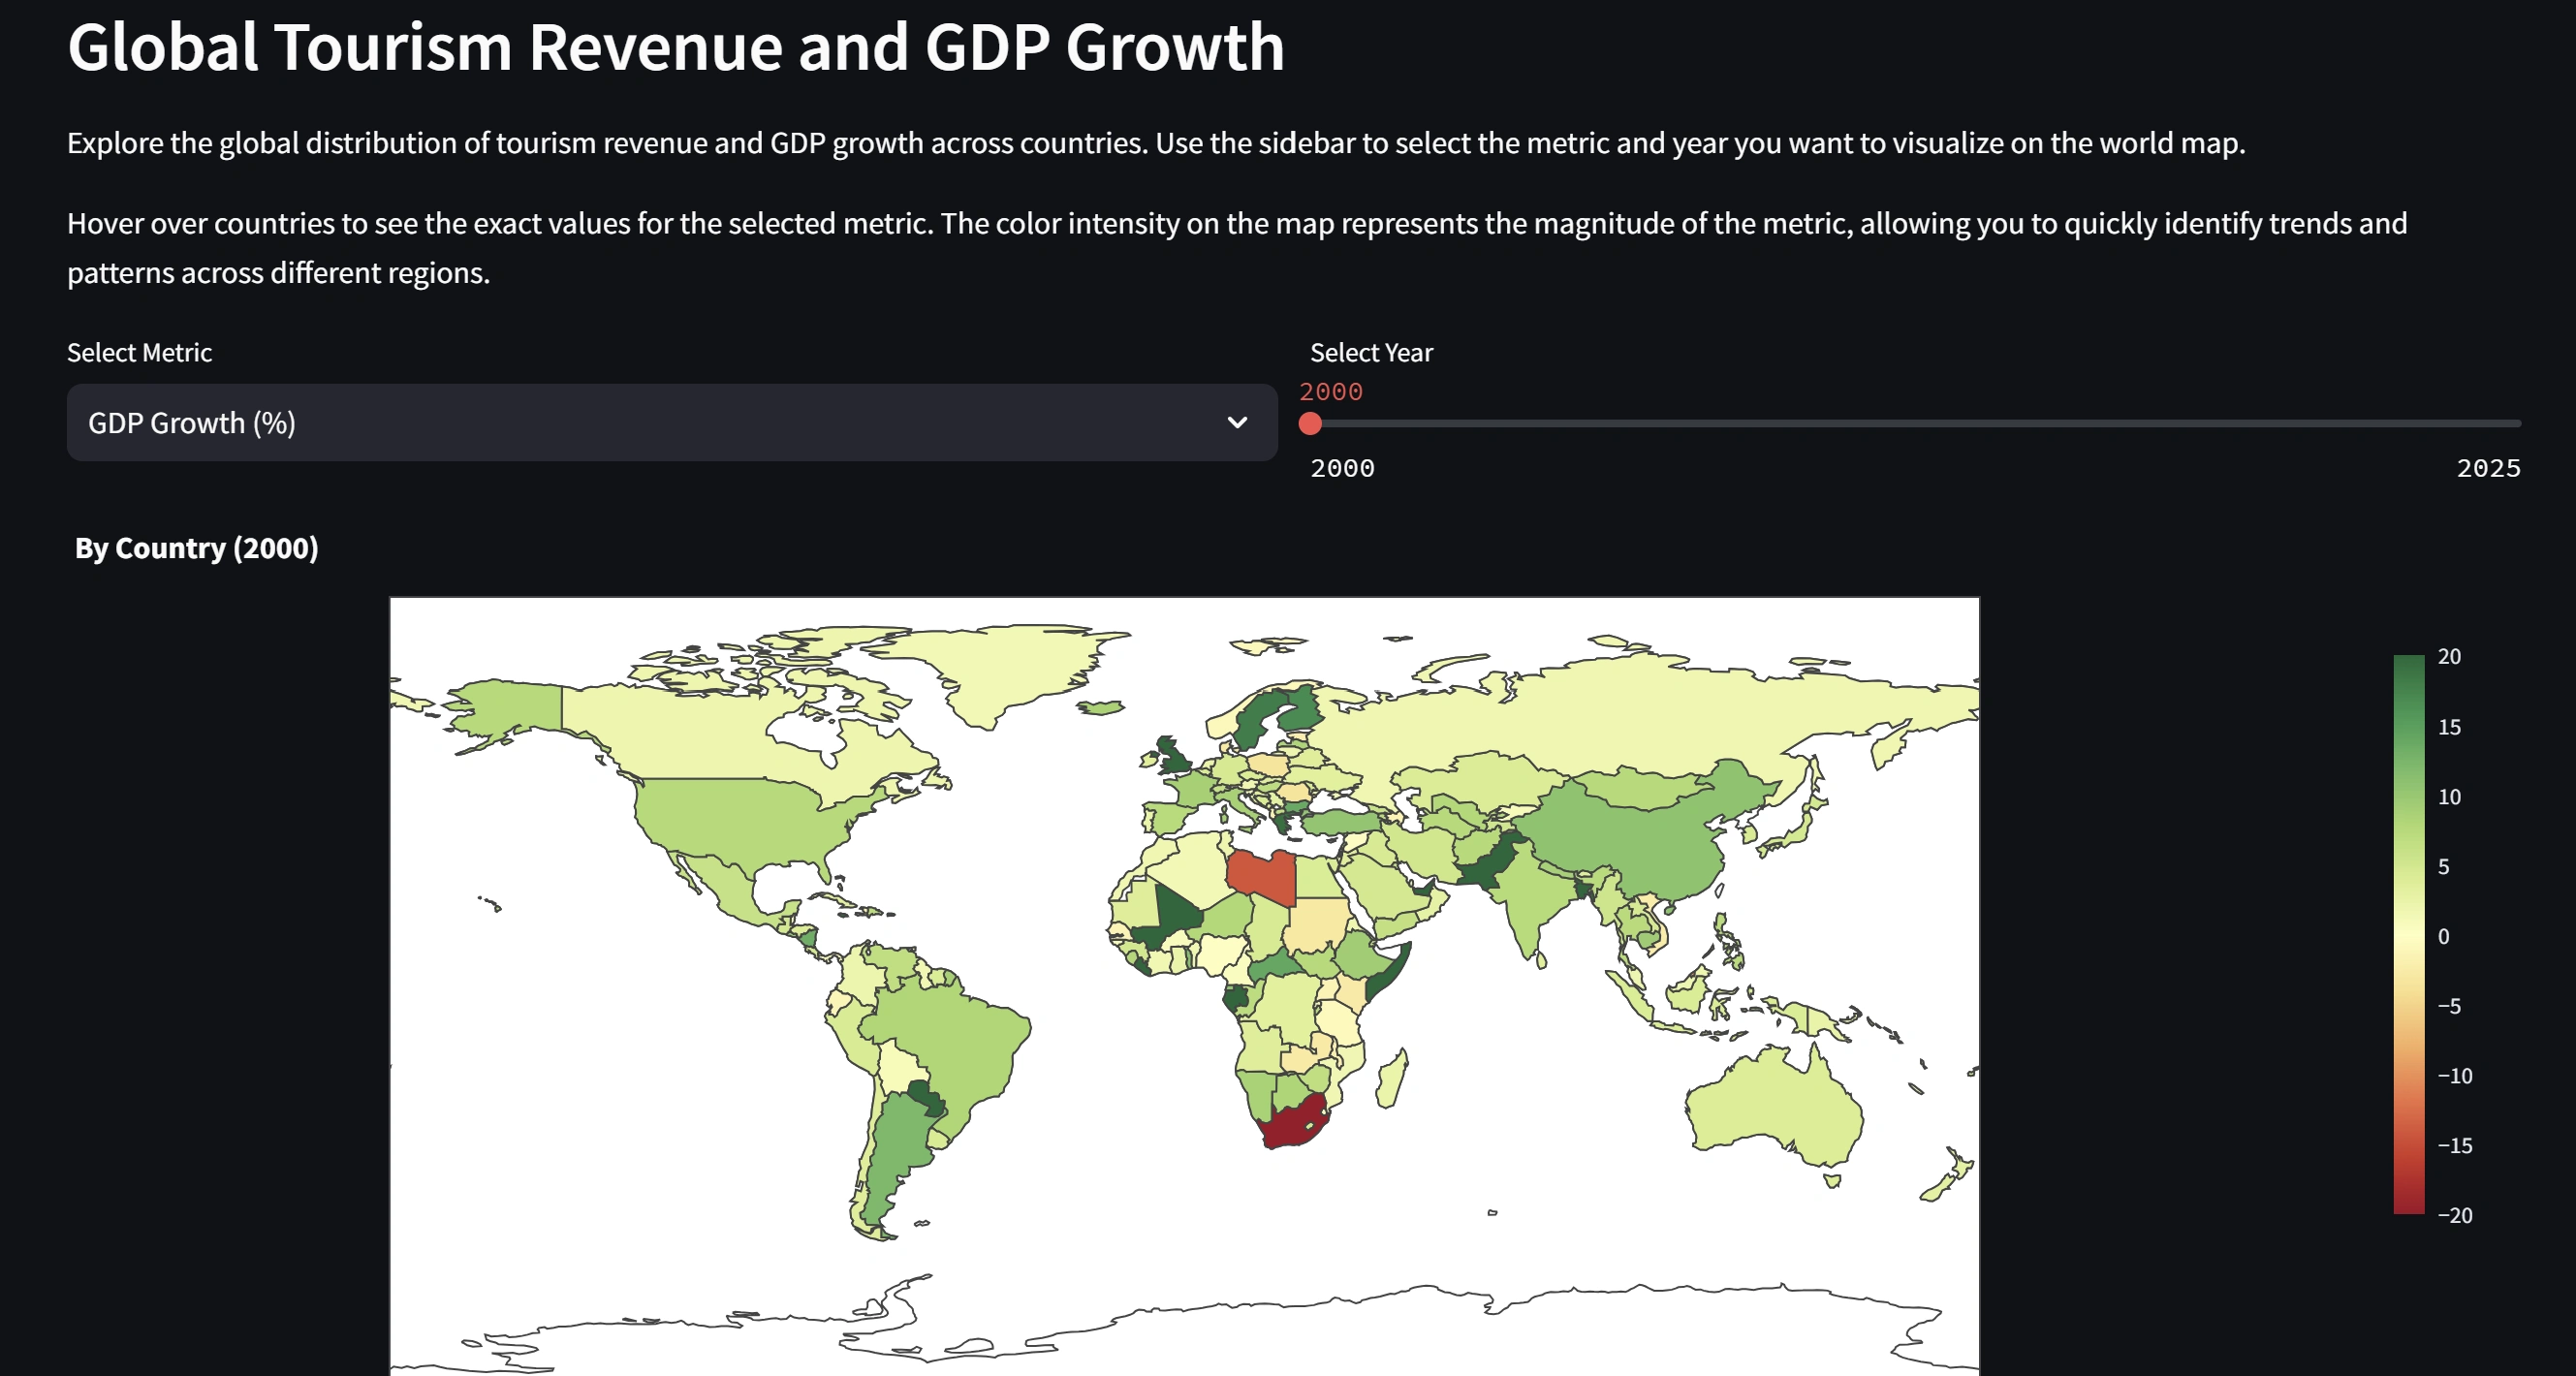
World Map Tab
Interactive choropleth map visualizing tourism revenue or GDP growth by country
Year slider to explore temporal changes
Metric selector to toggle between GDP growth and tourism revenue
Custom color scales and hover information
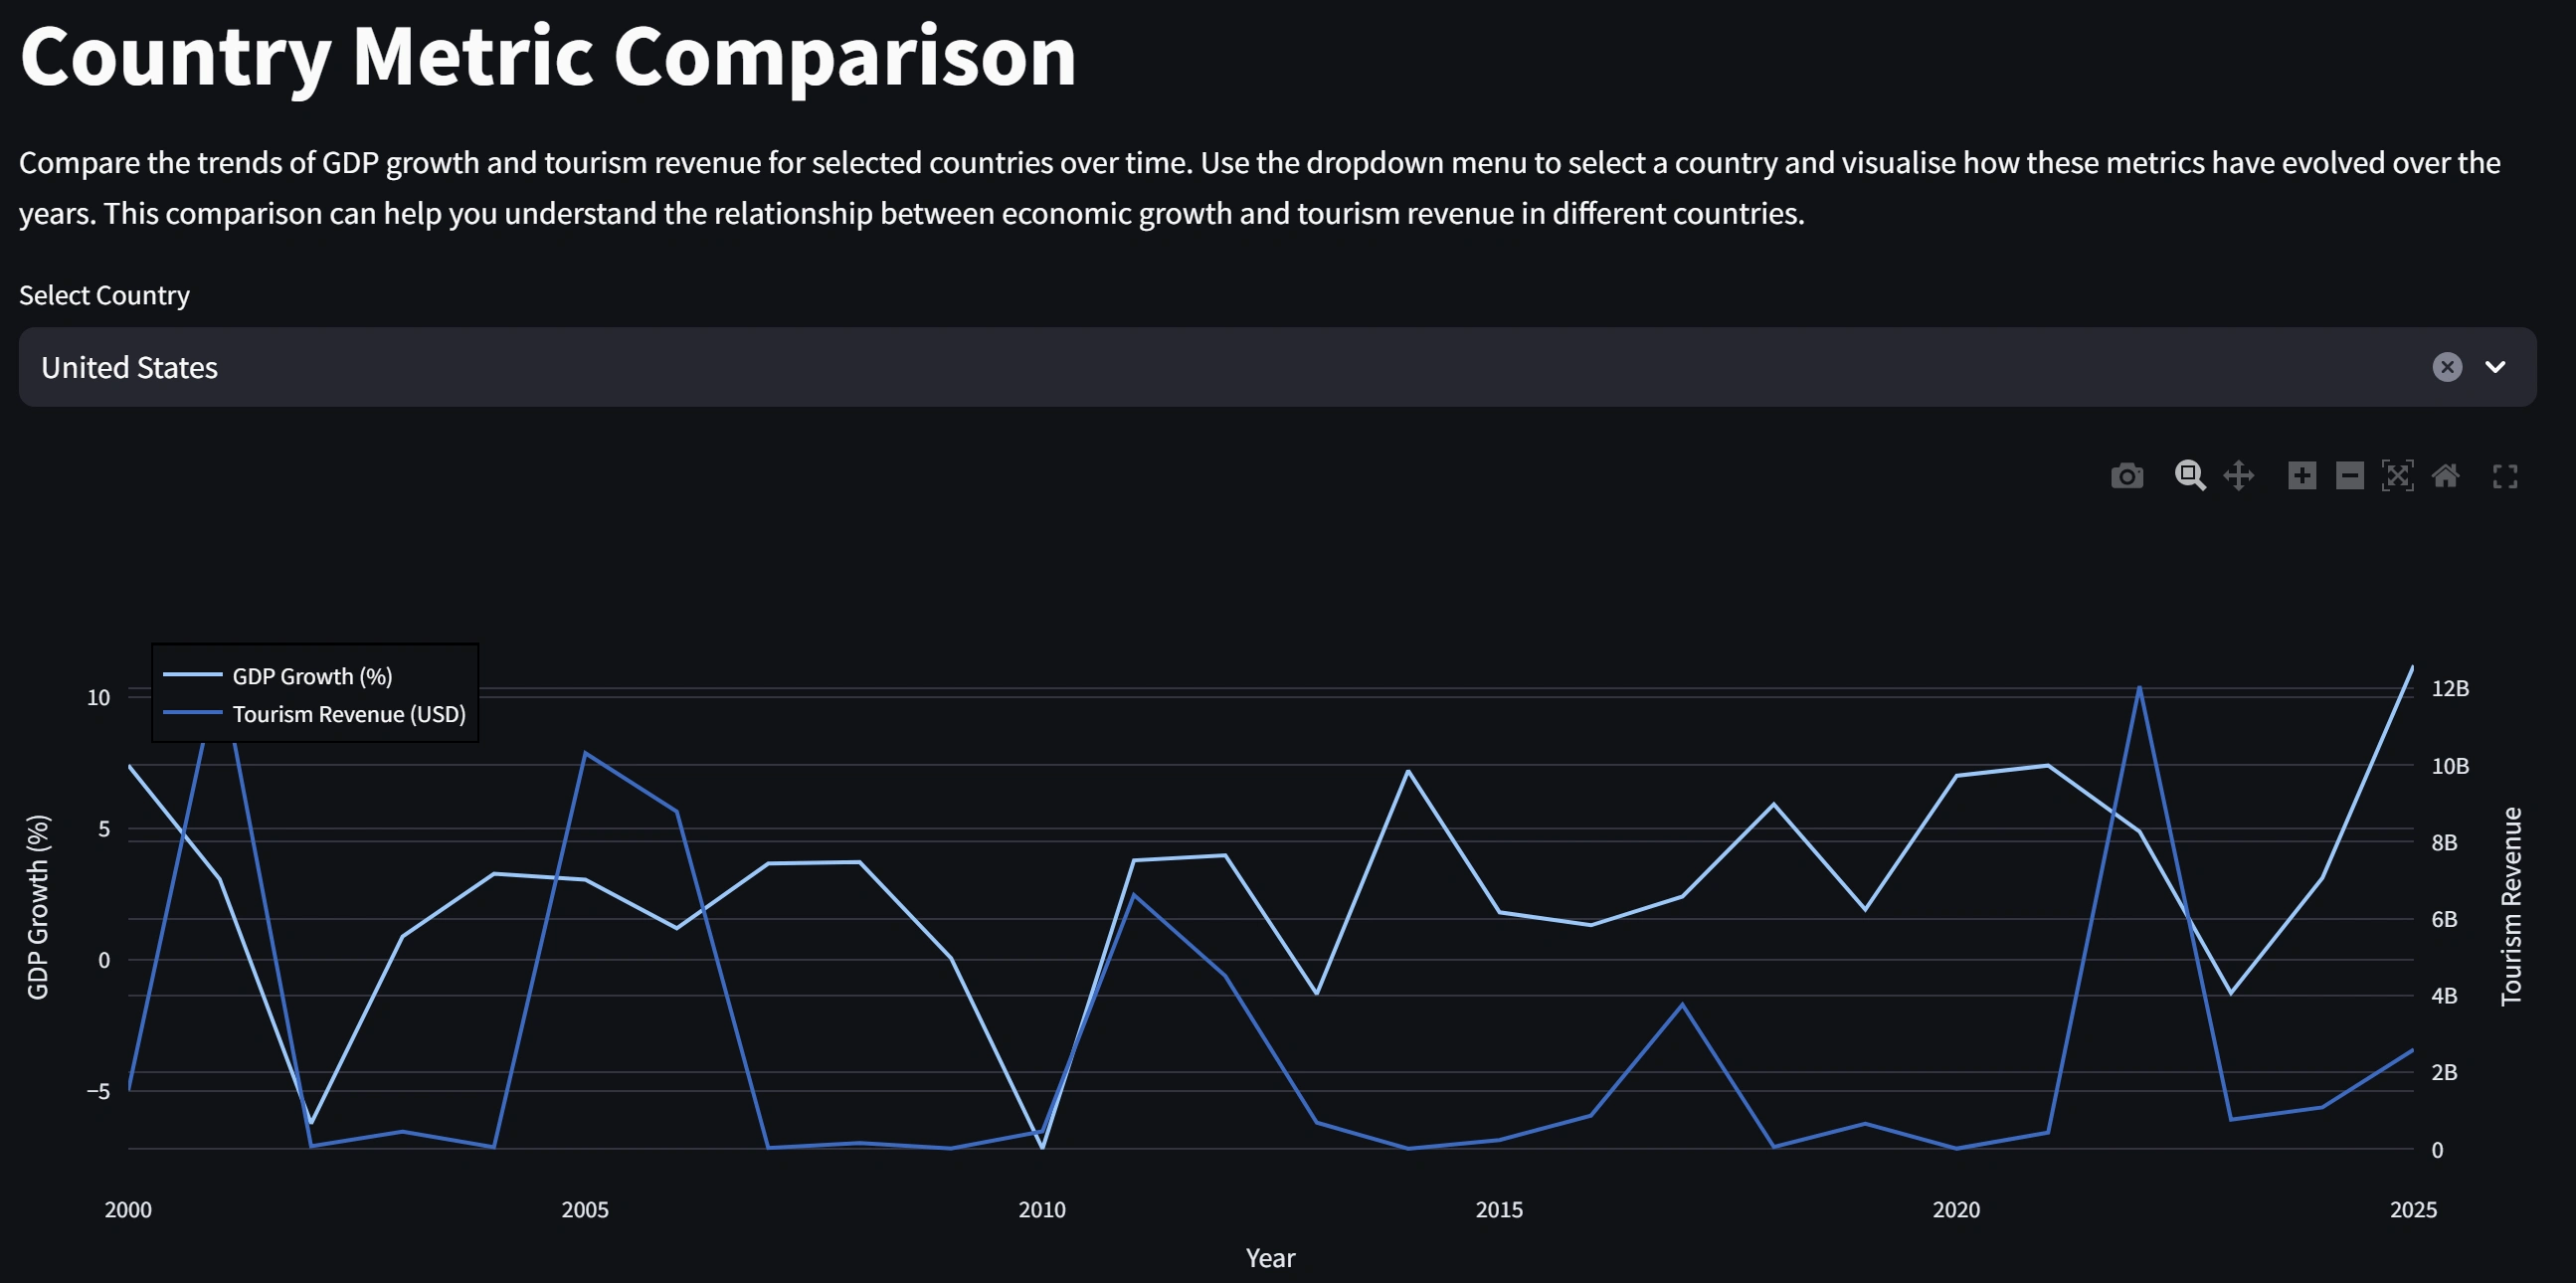
Country Comparison Tab
Dual-axis line chart comparing GDP growth and tourism revenue over time
Country selector to analyze specific nations
Clear trend visualization across multiple years
Technologies Used
Streamlit: Dashboard framework
Plotly: Interactive visualizations (choropleth maps, line charts)
Pandas: Data manipulation and processing
KaggleHub: Dataset download and management
Getting Started
Prerequisites
Python 3.8 or higher
Bash shell (Git Bash, WSL, or native Linux/Mac terminal)
Make utility
Installation & Running
Note: This project uses a Makefile and should be run in a Bash environment.
Clone the repository (or download the project files)
Install dependencies:
Download the dataset:
Transform the data:
Run the dashboard:
Open your browser and navigate to the URL shown in the terminal (typically
http://localhost:8501)Optional: Remove Data Files
To clean up downloaded data files:
Project Structure
Data Source
The dataset is sourced from Kaggle: Global Tourism Revenue and GDP Growth Dataset
Note: This project prioritizes showcasing dashboard development skills. While the data provides meaningful insights, there may be minor inconsistencies or gaps in the dataset.
Development Notes
This project was developed as a portfolio piece to demonstrate:
Building interactive dashboards with Streamlit
Creating complex visualizations with Plotly
Data pipeline development (download → transform → visualize)
UI/UX design for data exploration tools
Automation with Makefiles
Future Enhancements
Potential improvements for future iterations:
Add more statistical analysis and correlations
Include additional metrics (e.g., visitor numbers, average spend)
Implement data caching for improved performance
Add export functionality for charts and filtered data
Expand comparison capabilities (multi-country comparisons)
License
This project is available for educational and portfolio purposes.
Contact
Feel free to reach out with questions or feedback about this portfolio project!
Like this project
Posted Feb 25, 2026
Developed an interactive tourism dashboard with Streamlit and Plotly.
Likes
0
Views
5