Apple Sales Dashboard
Kris Bruurs
Apple Sales Dashboard
Portfolio Project Overview
This project is part of my data portfolio and was built to learn end-to-end dashboard development with Python and Streamlit.
The goal was to practice turning raw data into clear, interactive business insights through data preparation, visual analysis, and dashboard design.
What This Project Does
The Apple Sales Dashboard is an interactive analytics app that explores sales performance from multiple perspectives:
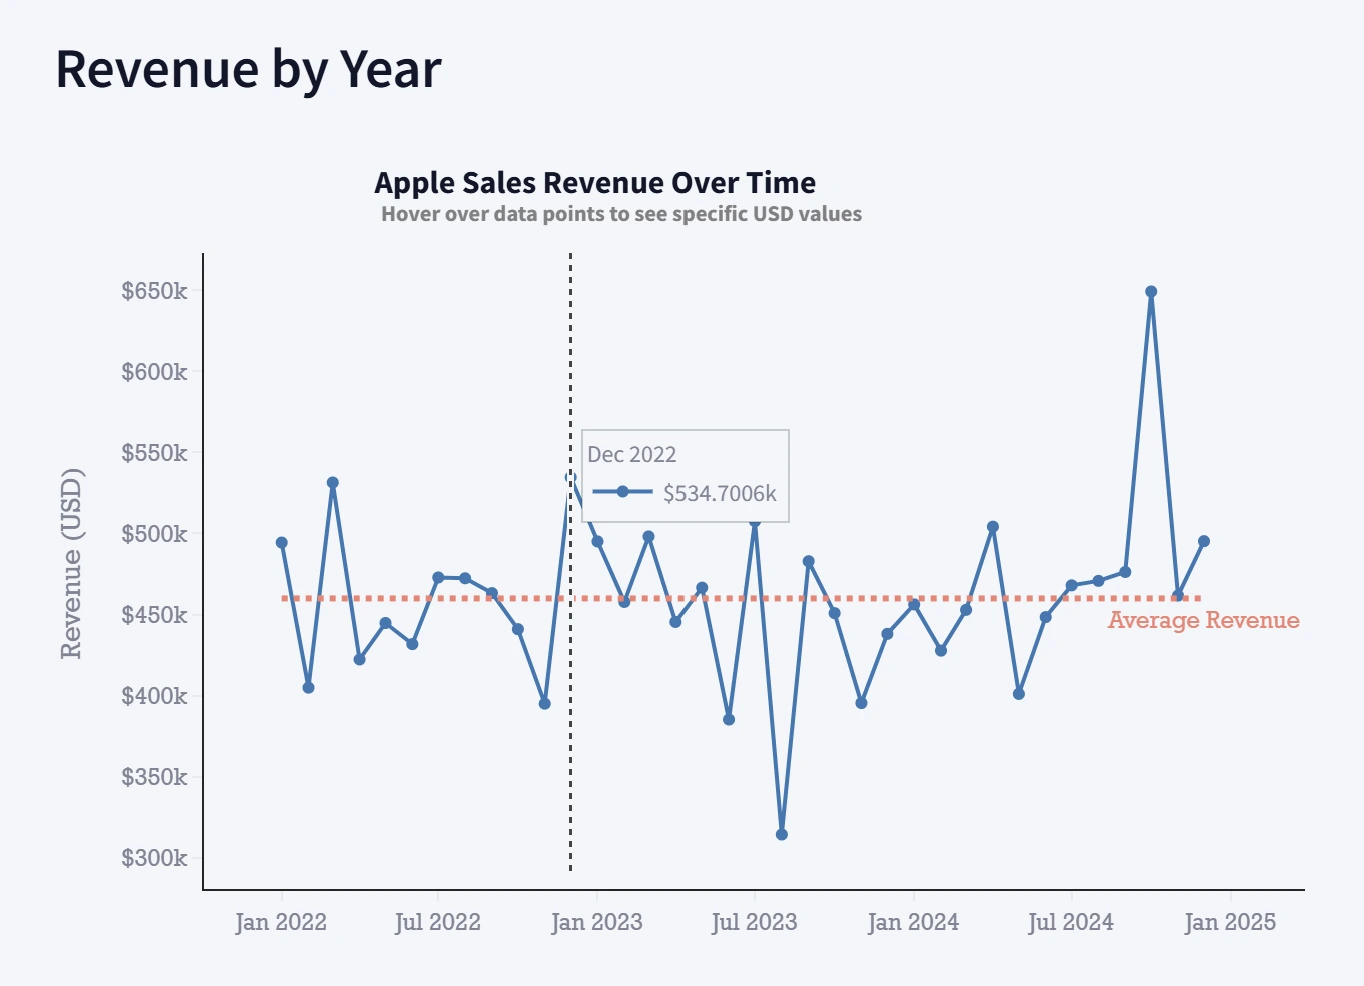
Executive Overview: high-level KPIs and yearly trends
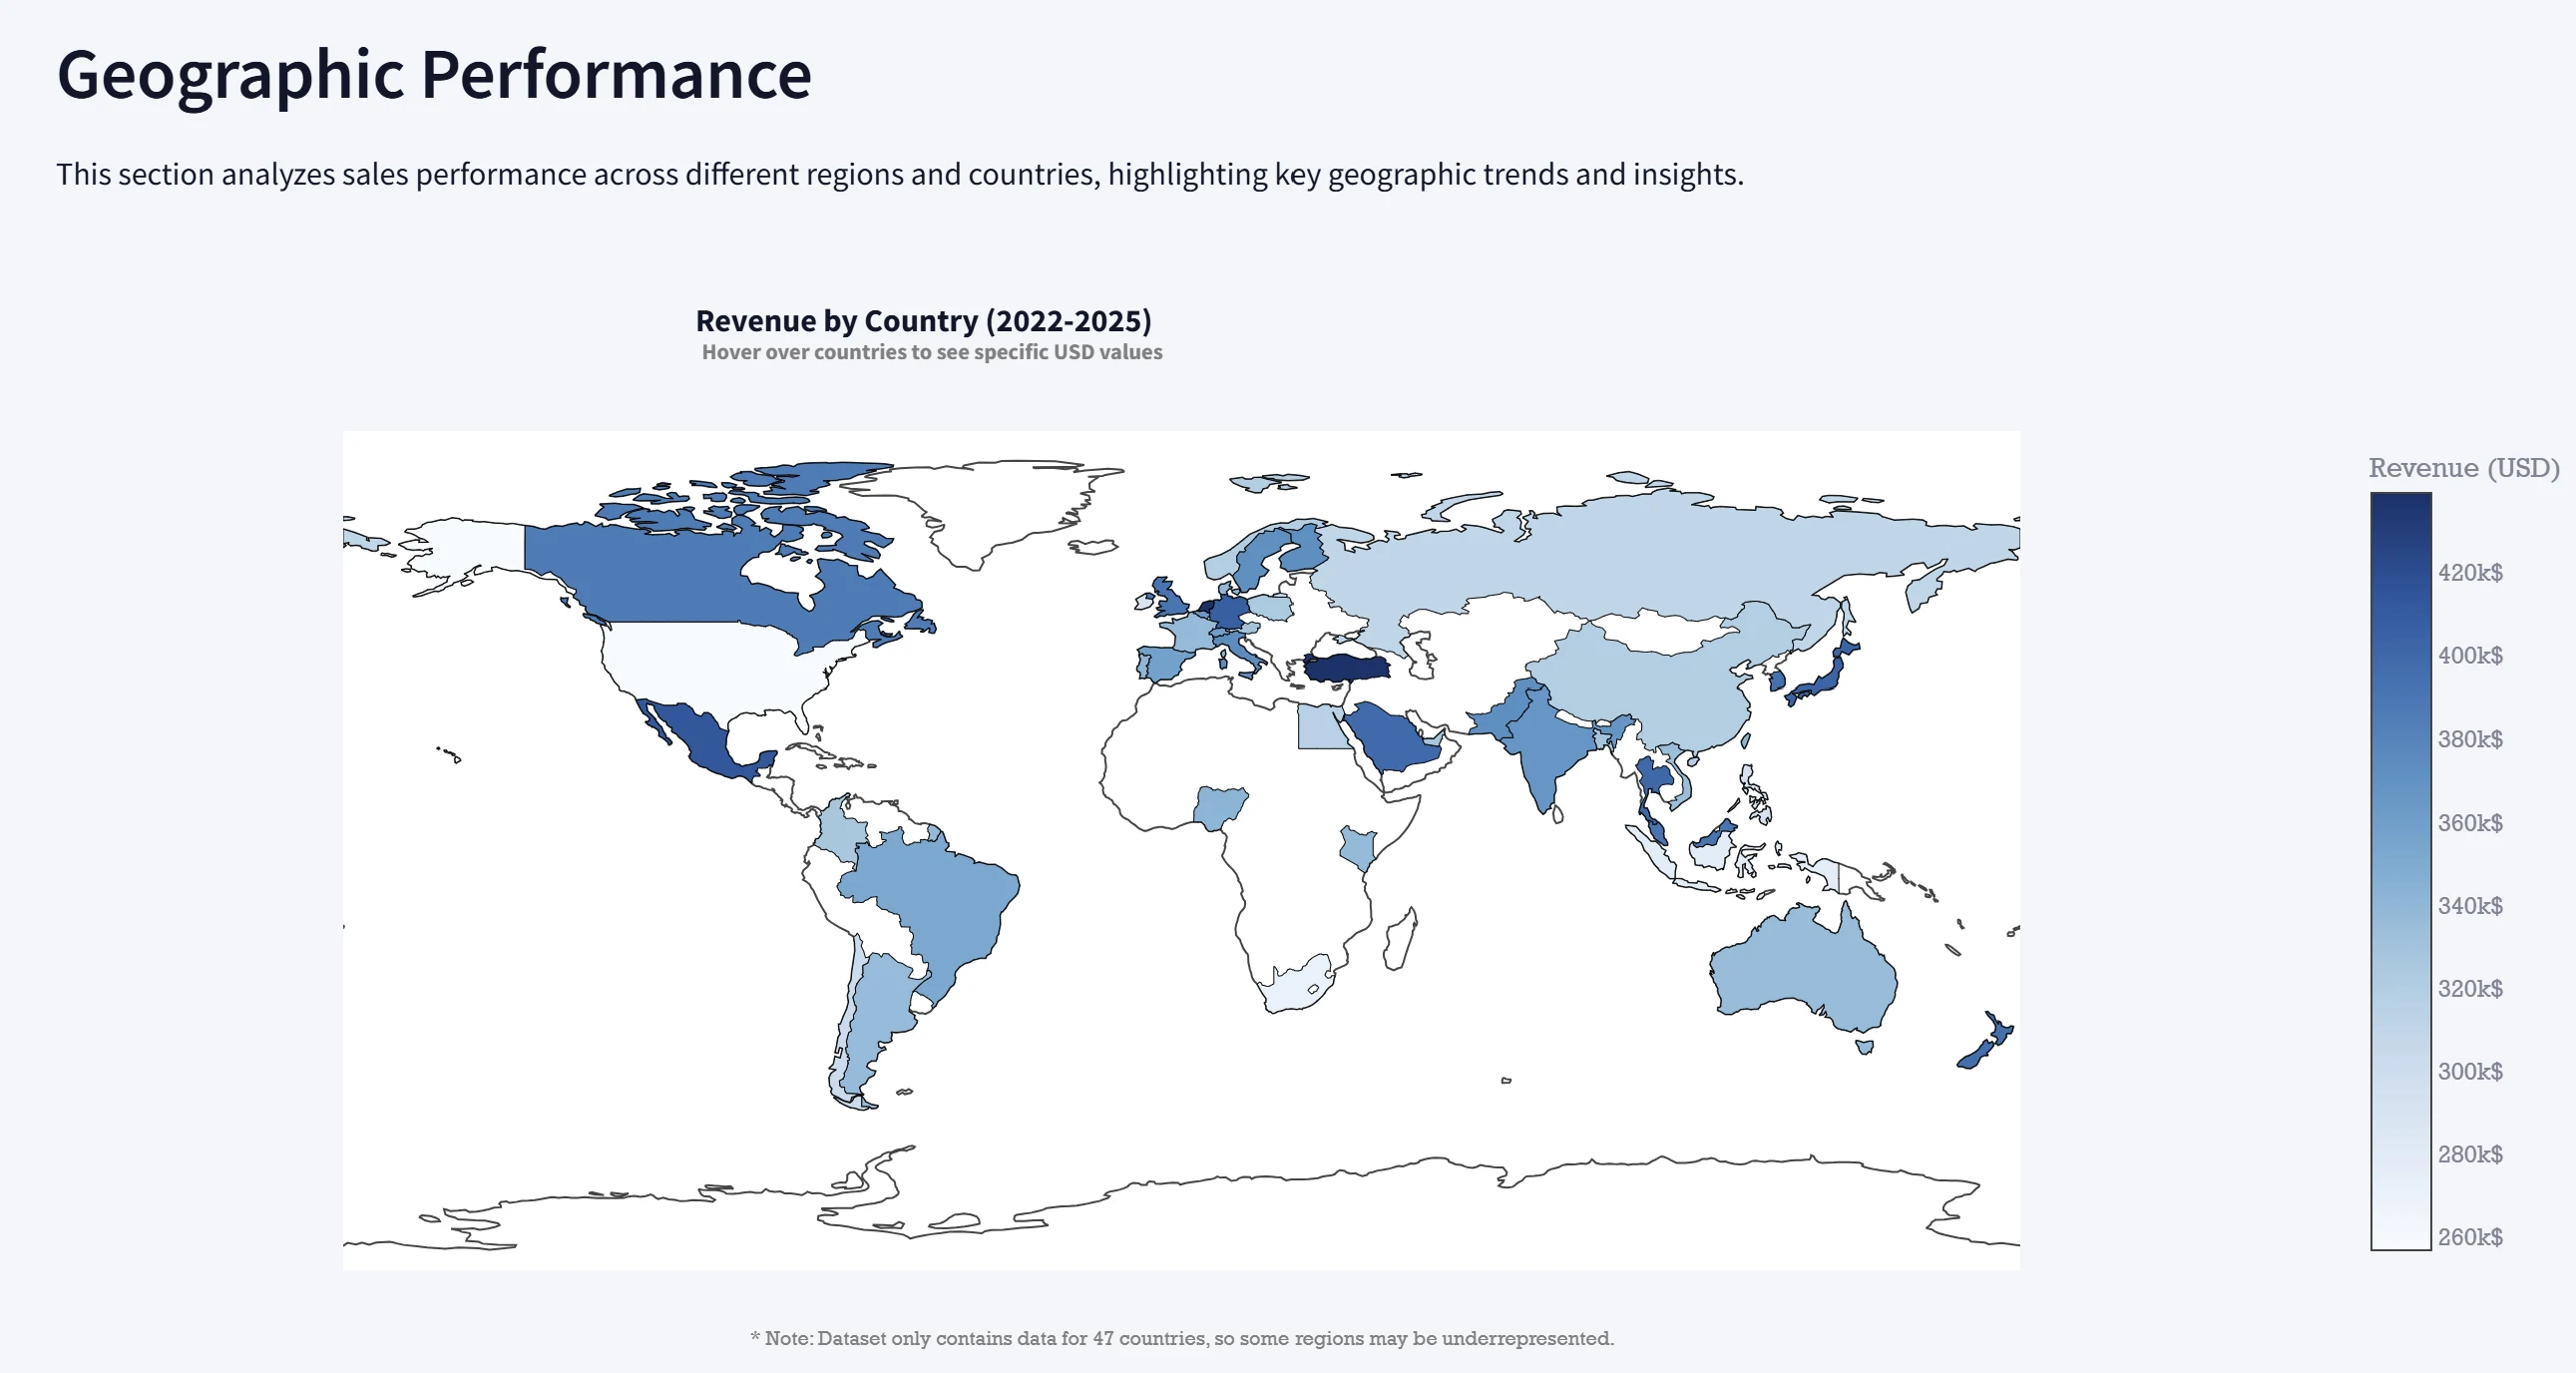
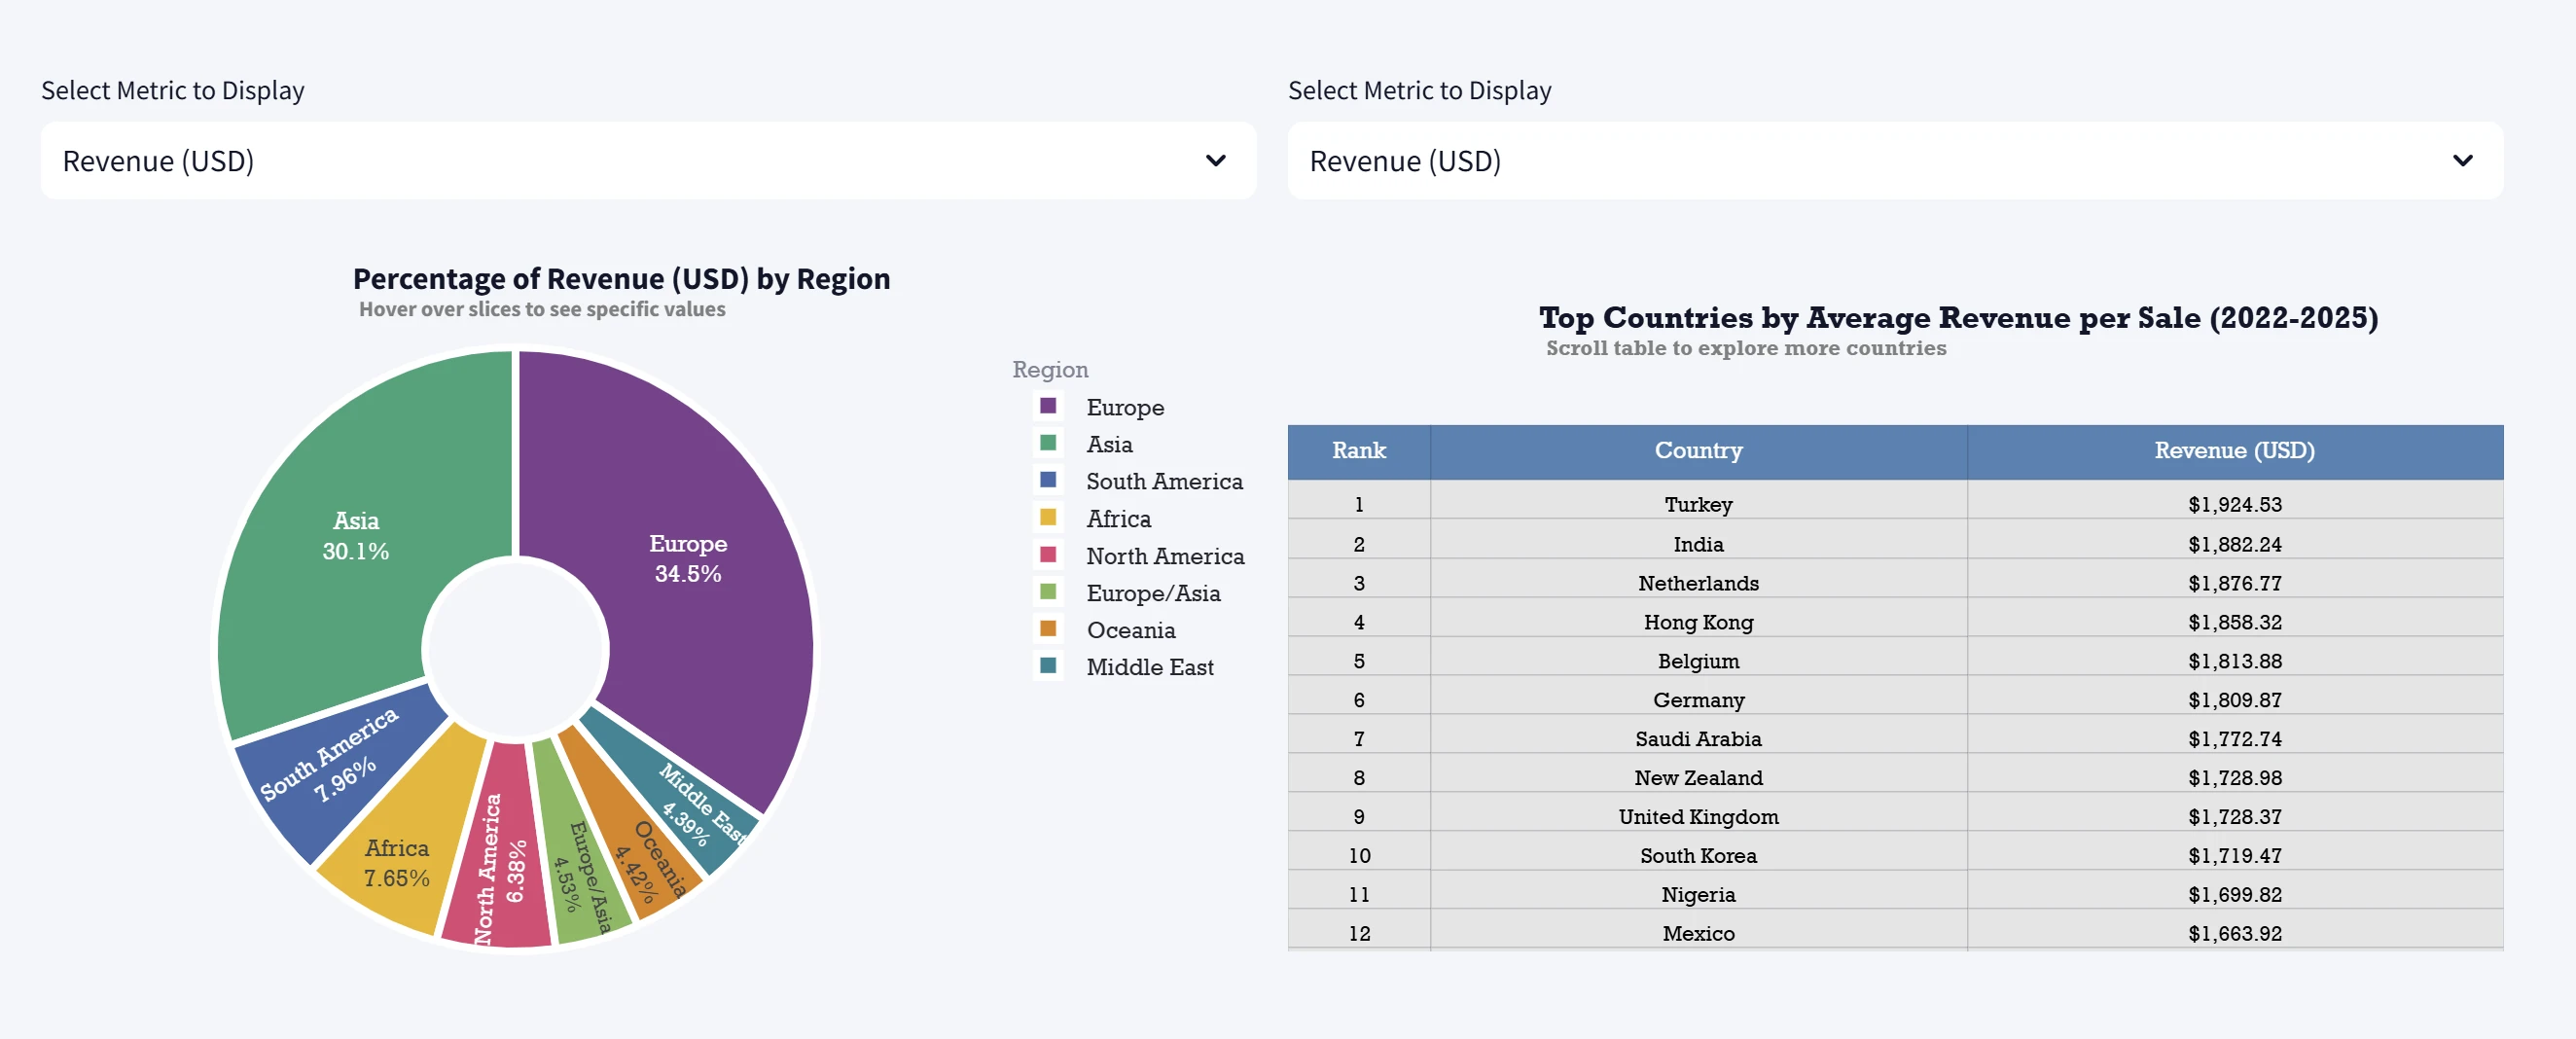
Geographic Performance: country-level choropleth map and regional breakdowns
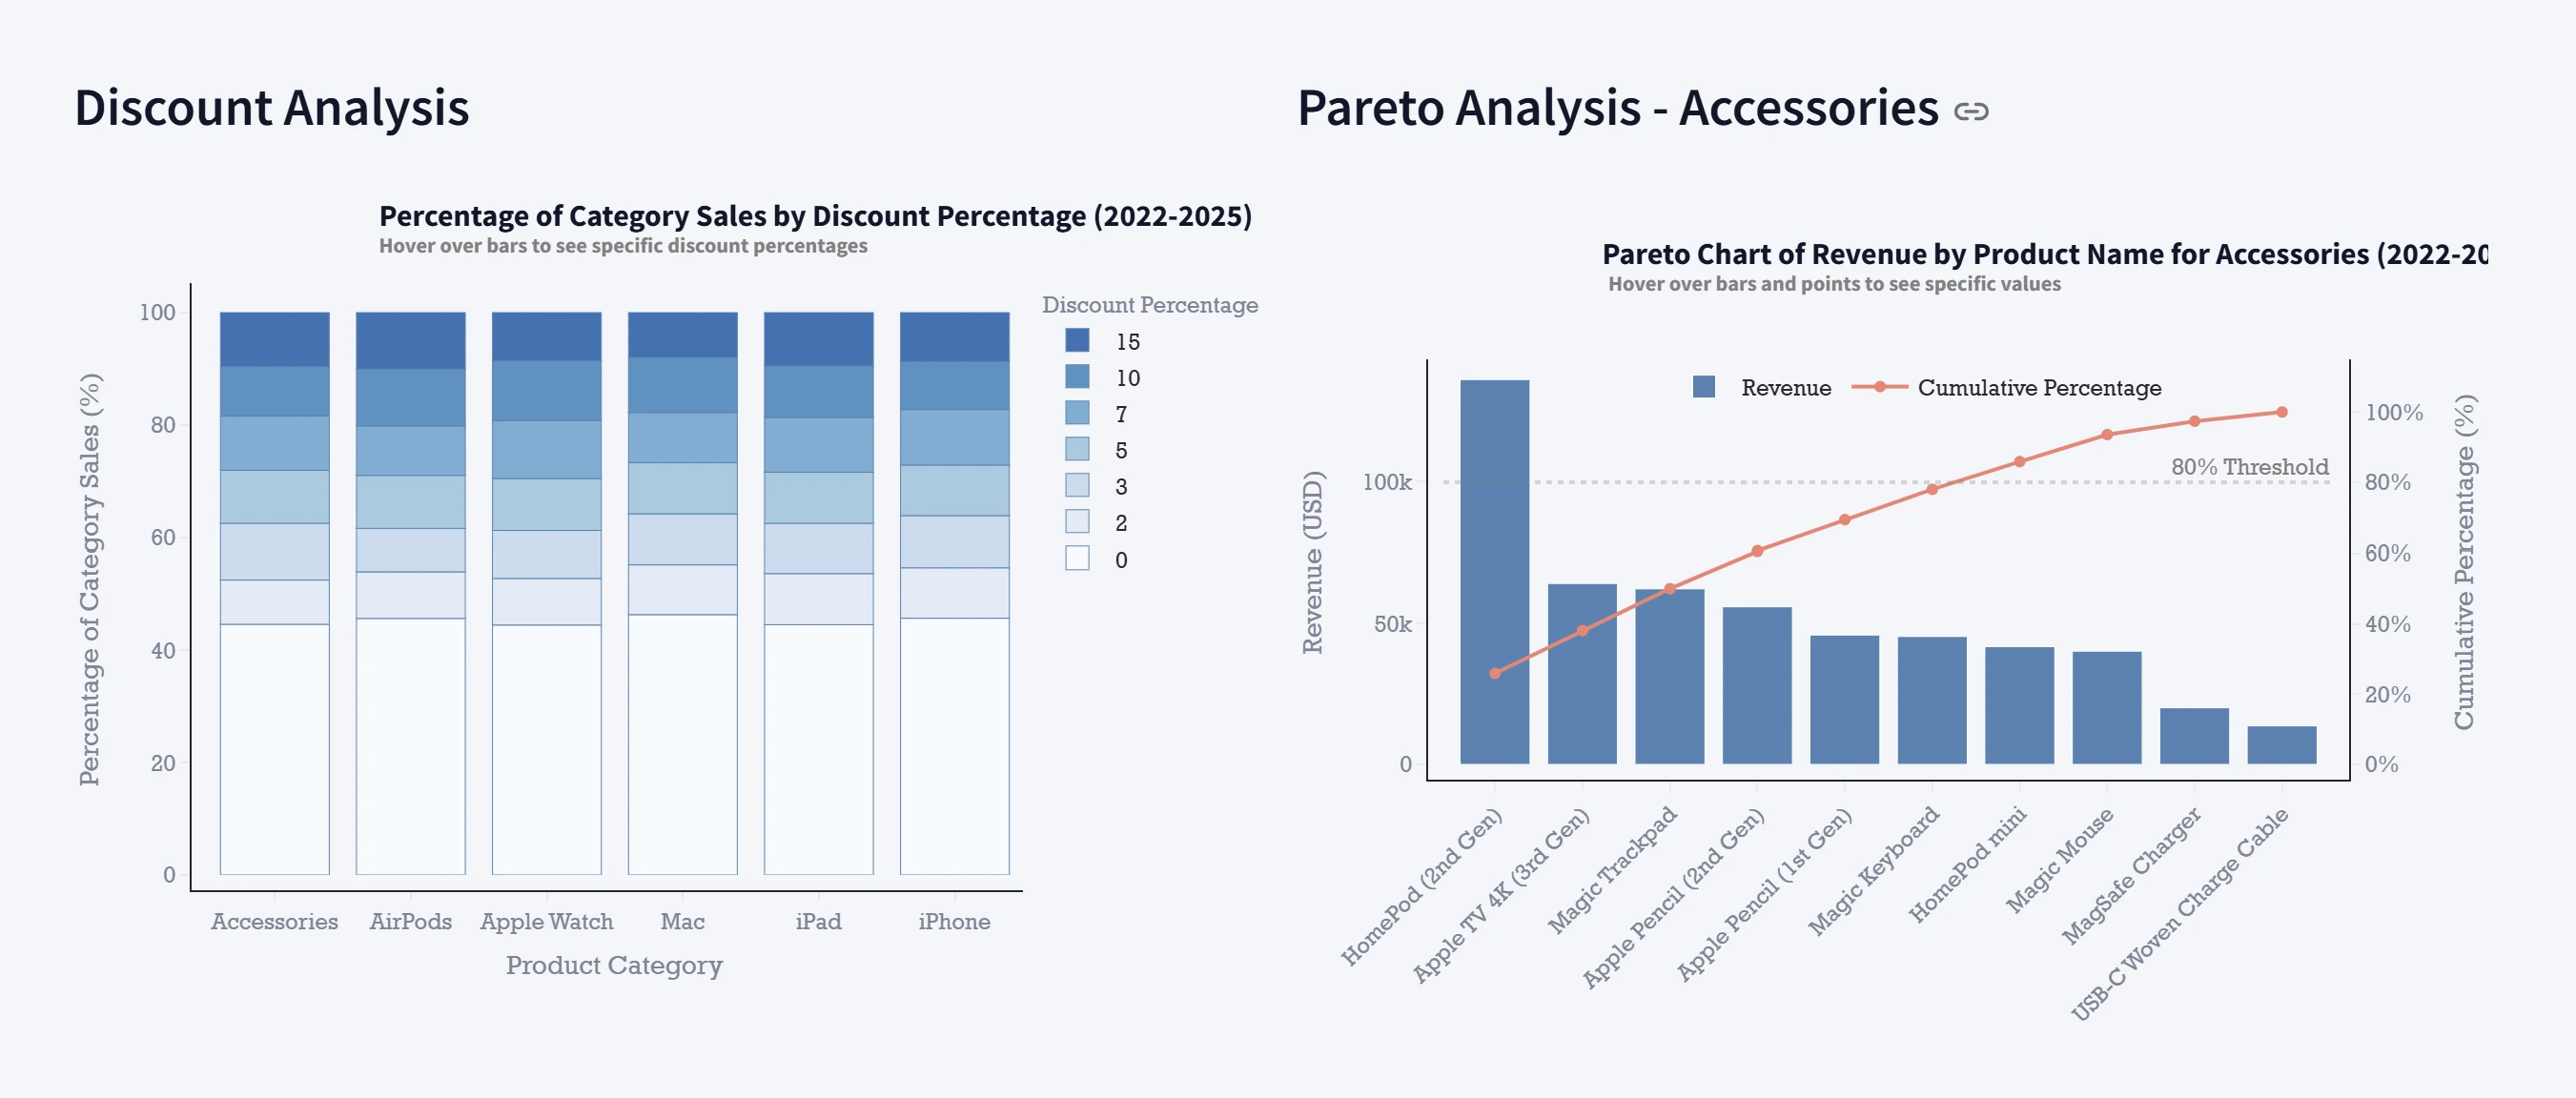
Product & Pricing Analytics: category performance, discount behavior, and Pareto analysis
Customer Insights: age-group performance, rating distribution, and return behavior
The dashboard is designed to simulate a realistic business reporting experience and demonstrate practical data storytelling.
Important Note About the Data
This project uses a synthetic dataset created for training and portfolio purposes.
It does not represent real Apple customer or sales data.
Tech Stack
Python
Pandas
Plotly
Streamlit
Makefile automation
Project Structure
download_data.py – creates/downloads source datatransfrom.py – transforms raw data into analysis-ready formatapp.py – Streamlit dashboard applicationrequirements.txt – Python dependencies for this projectdata/ – raw and transformed datasetsHow to Run
1) Install dependencies
If you already have a virtual environment, activate it first. Then install dependencies:
2) Run the full pipeline (recommended)
This will:
install dependencies
download/generate data
transform the data
start the dashboard
3) Run steps individually (optional)
4) Open the dashboard
After
streamlit run app.py starts, open the local URL shown in the terminal (typically http://localhost:8501).Why I Built This
I built this project to strengthen practical dashboard-building skills, including:
designing clear visual layouts for different audiences
adding interactivity (selectors, tabs, responsive charts)
automating a simple data pipeline
presenting analysis in a business-friendly format
It demonstrates not only chart creation, but also how to structure an analytics app that is easy to run, explore, and extend.
Like this project
Posted Feb 28, 2026
Developed an interactive Apple Sales Dashboard using Streamlit.
Likes
0
Views
2